Hi,
I have created nodes which use PHP code to create graphs using data from a MYSQL database. When I view each node everything is perfect and the graph displays perfectly.
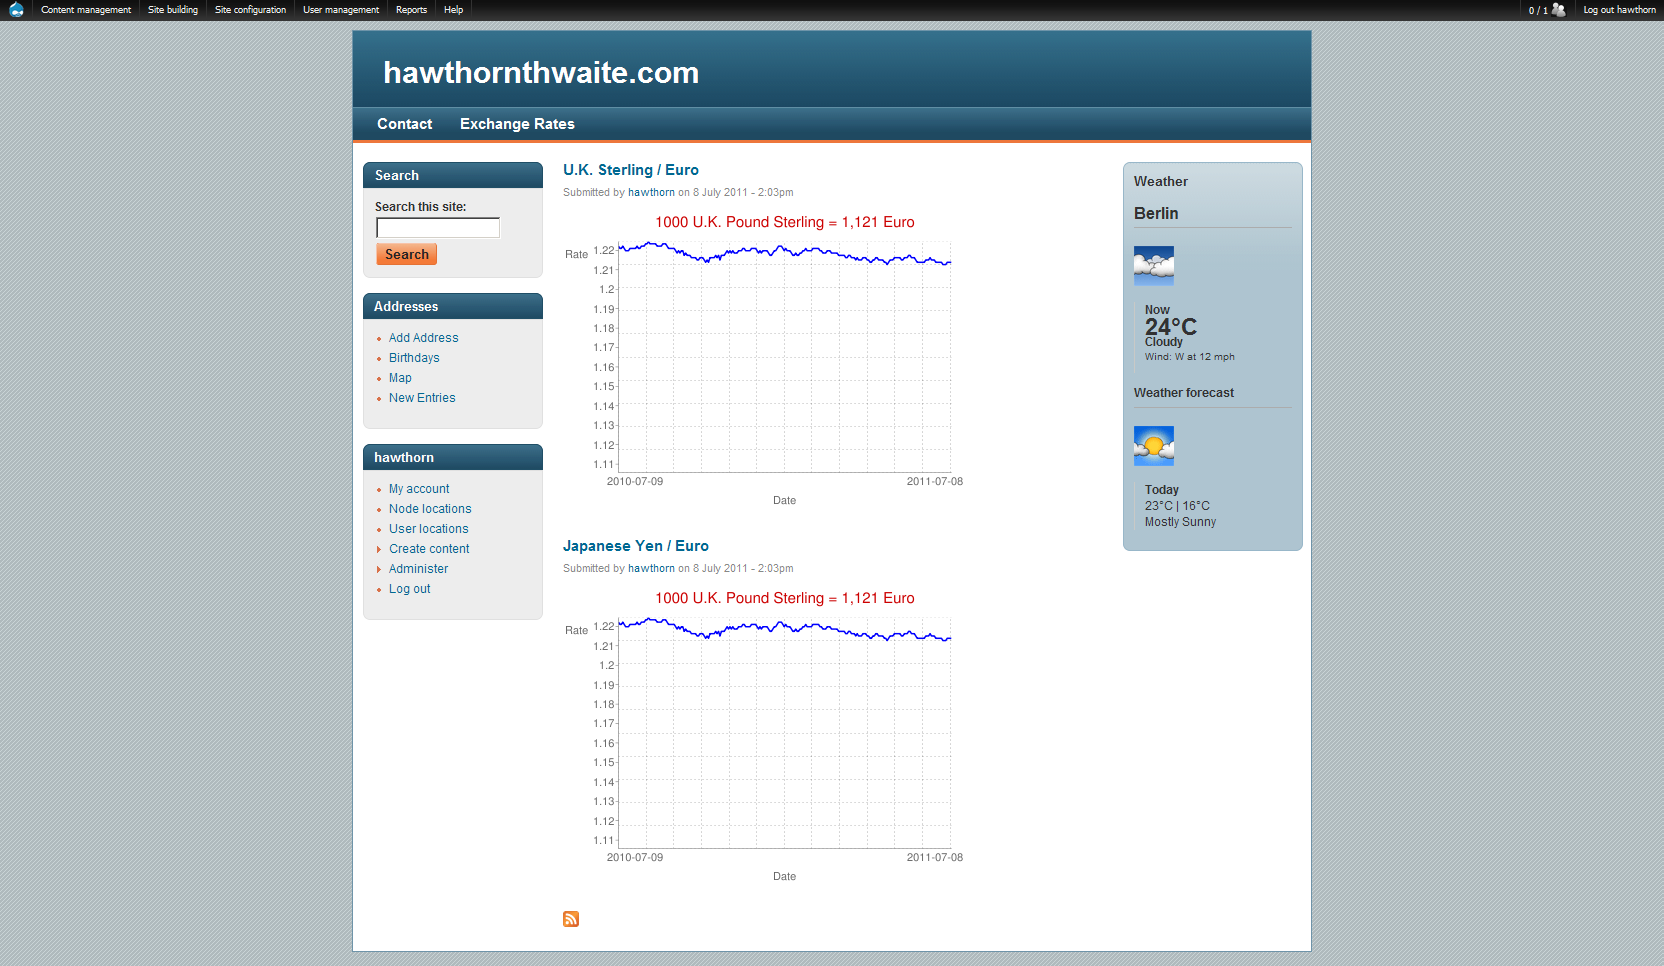
But when I promote two nodes to the front page, or put two graphs into a panel, or use a view to display the graphs, all the graphs are the same i.e. they are repeats of the first graph.
the picture shows two graphs which should show different currency rates but the second graph is just a repeat of the first one.
Is it possible to have two graphs on one page?
thanks for your help
Rich


Comments
Comment #1
richH commentedSorry my mistake - I hadn't used a unique chart_id.
Comment #2
vkouroub commentedHi richH. I have the exact problem you had. Can you please explain in more detail how you solved this? Where and how can we define a unique id for every chart because i don't see anything in Views.
Comment #3
richH commentedHi,
it was ages ago that I solved this, and I didn't sleep much last night, so I'll see if I can get the brain-cogs working. If it doesn't make sense, keep asking and I'll try to write a better answer!!
My data is in a non-drupal database, so I have a PHP field in a view which I use to create a google chart. The drupal node simply contains the currency codes (e.g. EUR, USD) which are used my the php code.
In the creation of the chart parameters array, I set a chart_id and use the php function uniq_id(), to generate a unique ID:
Other parameters for the cart are set from the database...
and data is added to the chart:
and lastly the chart is displayed
But the setting of the chart_id in the parameters was critical.
Hope this helps,
Rich
Comment #4
funkeyrandy commentedsorry to reopen, but i have the most basic code to display 2 graphs on a page, and only 1 shows...the other shows a broken thumb..here is my code:
Comment #5
Pierre.Vriens commentedRandy, sorry it took about 2 years to have somebody get back to you ... Reopening this issue, which APPEARS similar, seems fine to me. However a "support Request" that is classified as "critical" (as you changed it to), often doesn't get a lot of attention from people contributing in their spare time (as I also do right now ...). That's what professional support / services is about, at least in my opinion.
Anyway, can you provide a status update about this issue please? If resolved, it might help others if you can add some details about what the solution was.
Comment #6
Pierre.Vriens commentedA pitty Randy seems to have moved on ... About 1 week later no feedback received. Therefor I'm updating this issue. Feel free to reopen if needed.