Active
Project:
Charts and Graphs
Version:
6.x-2.7
Component:
Code
Priority:
Normal
Category:
Task
Assigned:
Unassigned
Reporter:
Created:
25 Aug 2011 at 13:04 UTC
Updated:
25 Aug 2011 at 16:56 UTC
Jump to comment: Most recent file

I've recently installed this great module but I can't find where one can customize the tooltip. I am using version 6.x-2.7. Hacking the module was okay,I could change some properties this way but the tooltip one is total mystery.
It is said that the default string display is set to "#x_label# #val#" (http://drupal.org/node/193567) which is actually good.
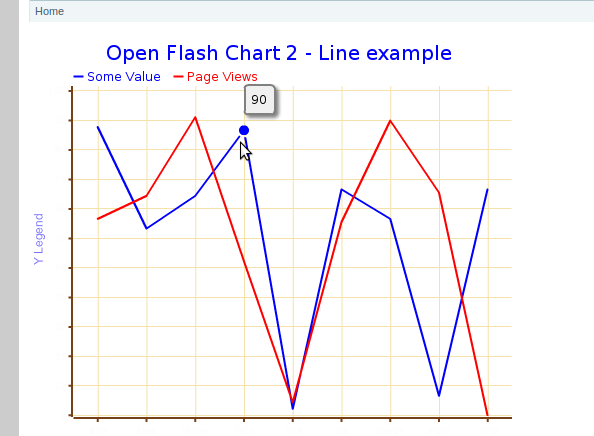
Unfortunately,I can only see the value on the x-axis(#val#) on both my charts and on the example show
at /charts_graphs/test/open-flash/line/Open Flash Chart 2 - Line example
Thanks
| Comment | File | Size | Author |
|---|---|---|---|
| #1 | Screenshot-1.png | 24.3 KB | knd |
| Screenshot.png | 23.15 KB | knd |

Comments
Comment #1
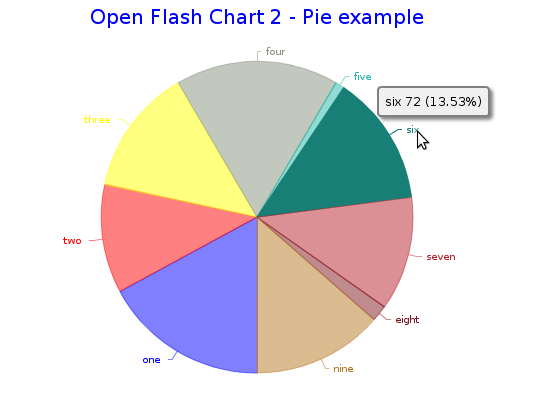
knd commentedNow this is weird,it looks like the pie chart type is the only OFC2(Open Flash Chart v2) chart's type able to display the full default tooltip(#x_label#val#) correctly to obtain something like "January 2011;6,5(19%)".
Some types display something like "#x_label#;6,5" while others just omit the #x_label#.
Anybody knows why,I need to show a line type chart with OFC2 with the default tooltip ?
Thanks