

Needs review
Project:
Highcharts
Version:
7.x-1.x-dev
Component:
API
Priority:
Normal
Category:
Support request
Assigned:
Unassigned
Reporter:
Created:
26 Oct 2011 at 08:32 UTC
Updated:
10 Mar 2013 at 14:53 UTC
Jump to comment: Most recent file

Comments
Comment #1
stovak commentedCan you give me some more specifics on reproducing this?
Comment #2
Sinan Erdem commentedOf course.
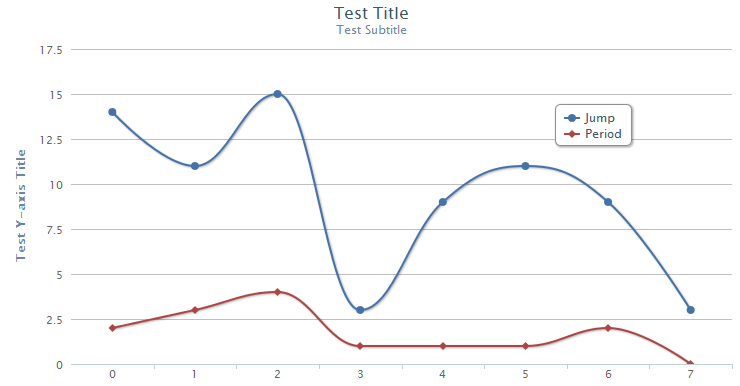
I have two integer fields "jumpdata" and "period". They are multi-valued fields, but i only use the last integer from each field. I also added node:nid as another field.
I have 8 nodes containing this fields.
So what I have is:
Node 1: jumpdata:14 period:2
Node 2: jumpdata:11 period:3
Node 3: jumpdata:15 period:4
Node 4: jumpdata:3 period:1
Node 5: jumpdata:9 period:1
Node 6: jumpdata:11 period:1
Node 7: jumpdata:9 period:2
Node 8: jumpdata:3 period:0
I actually need jumpdata and period on the y-axis and nid (or any other field, maybe an integer field) on the x-axis. What I get is numbers from 0 to 7 on the x-axis.
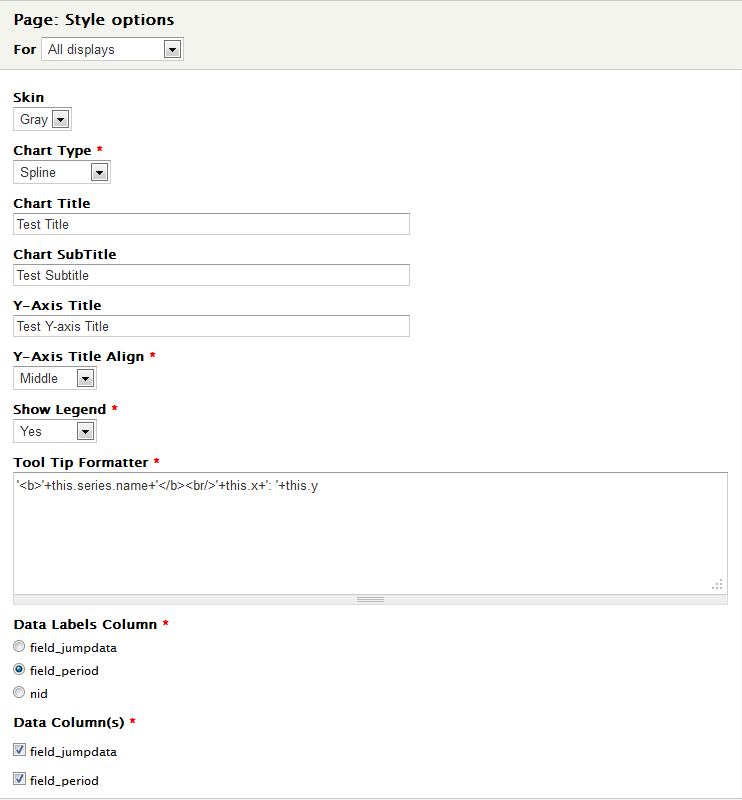
I thought "Data labels column" is related but when I change it, nothing changes.
I am attaching my settings and results if you wanna look.
Thanks.
Sinan
Comment #3
Sinan Erdem commentedWhat I observe now is that if I add the "content: title" as a field, it is used as the x-axis values, no matter what I choose as "Data labels column".
If I remove "title" field, then numbers form 0 to 7 is displayed...
Comment #4
DerTobi75 commentedI have the same problem. I would like to have another field as X-Axis.
Is this possible in any way?
Comment #5
stovak commentedI will be working on improving it. I wrote the module for a book coming out. As soon as I finish the book I will be able to devote more time to its development. Will be trying to hit a few of these bugs over Thanksgiving weekend.
Comment #6
Sinan Erdem commentedI cannot wait to see this module fully working.
Charts and graphs are very important on many applications and I believe Opencharts is a very good and complete solution. This module is only inches away from giving almost all the things to a views user.
Comment #7
stovak commentedI will try to get this into the dev branch in the very near future.
Comment #8
DerTobi75 commented@stovak
Could you also add some more settings for the x & y-axis to the view?
yAxis: {
reversed: true
},
and min: and max: would be great.
TIA,
Tobi
Comment #9
stovak commentedYes, this will be in the Dev version soon.
Comment #10
DerTobi75 commentedGreat, can not wait to get it ;) Thank you!
Comment #11
stovak commentedLots of updates since this was an issue. Please update to latest DEV and double check to see if this is still an issue.
Comment #12
Alexander_Gurov commentedHi, I cant find a way to use any field data for x-axis. Could you please provide some info about how could I make it?
Comment #13
Alexander_Gurov commentedSmall update:
I created some new option in highchart views plugin in options_form
and using it to fill xAxis.categories property in chart objectlike that from views_highcharts.views.inc in preprocess function
Could you please say me what for do you use Data Labels Column ( $form['x_axis']['dataset_label'] )? I just cant find where that option is used in code.
Comment #14
stovak commentedPushed up a fix for x-axis labels in Alpha 4 release.
Comment #15
guillaumev commentedStill have issues here, trying to use a taxonomy term name as the X axis label
Comment #16
guillaumev commentedHere is an initial patch. It might need some more care, but it works for me...
Comment #17
scottrigbyThis needs reviews before it will be committed, as I'm not testing the 1.x branch.
In the 7.x-2.x branch this is not a problem, so we could close this issue - but I will keep this open because there is a patch that needs review by someone who uses the 1.x branch.