
Closed (fixed)
Project:
Highcharts
Version:
7.x-2.x-dev
Component:
API
Priority:
Normal
Category:
Feature request
Assigned:
Unassigned
Reporter:
Created:
26 Oct 2011 at 08:48 UTC
Updated:
8 Mar 2013 at 11:37 UTC
Jump to comment: Most recent, Most recent file

Comments
Comment #1
stovak commentedSo pie charts will require a rewrite of the way Data is supplied to the chart. I'm taking this as a feature request and i'll try to get to it in the next week or so.
Comment #2
stovak commentedAdded basic pie-chart functionality to DEV branch.
Comment #3
stovak commentedComment #4
somimi commentedI'm still getting "slice" for values in the pie chart. Relatedly, will the pie chart take views aggregation values?
Comment #5
stovak commentedGuys, i'm sorry for being out of pocket on this one. I've been in the process of moving from DC to California. I will take a look at this issue this weekend and commit a fix as it seems to generate a lot of traffic.
-tom
Comment #6
ipwa commentedThanks stovak, awesome module btw, great contribution. Most of the other modules I tried for graphing either dont have a d7 release and/or views 3 integration. Will be following this, because I want to set node titles instead of 'slice'.
Comment #7
ipwa commentedComment #8
Pun-1 commentedI'm not sure if this really helps or not - but I was working with the charts module and having the same issue on a pie graph with aggregated data. An outsource employee wrote this code in a custom module - not sure if I copied exactly what all you need, but here it is...
Comment #9
stovak commentedALL:
The stuff that creates a series for a PIE chart has been re-written with the "alpha2" release. Please verify that this is still an issue. I think you'll find that it is not.
-tom
Comment #10
Georgique commentedThink that it is still an issue in alpha3.
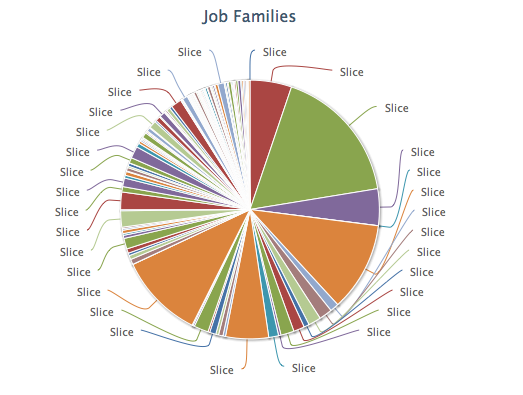
As you can see in attached screenshot, my chart have no labels and also no pies.
For pies I choose an aggregated value, for selected slice - title.
Comment #11
Georgique commentedComment #12
Sinan Erdem commentedConfirming Georgique's issue...
Comment #13
somimi commentedI'm not even getting a pie. Now, regardless of what I choose, I get some subset of the following errors (depending on the chart type I select):
Comment #14
somimi commentedSo, if I set all the required fields in the options form to not-required (i.e. '#required' => FALSE), I can get a functioning chart. Now I'm wondering: other graphs, like the bar graph, allow multiple nodes in one container. Is this possible with the pie chart? I want to show 3 individual charts at once, but what I'm getting instead is one pie chart with the sum of the fields, one field per slice.
Just curious.
Also, specific to my case, I had to aggregate it by a term reference in order for the data to graph at all. I enable the views aggregation and leave all the settings on default - all fields are "grouped together" by whatever the default value is for that field, and the pie chart shows up! The tooltip even works, although I'm not really sure where the formatter is coming from... it seems to be in the style of "field_name: x = field_name, y= this.y" or something like that.
Comment #15
Georgique commentedComment #16
Georgique commented@somimi, your issue is here: http://drupal.org/node/1489646
Comment #17
gomanual commentedConfirming Georgique's issue...
Comment #18
mikemadison commentedThis is still an issue in the 7.2x dev line as well. No matter which fields I select as the selected slice or pie pieces, it still just continues to say "slice".
@somimi can you please confirm where you "set all the required fields in the options form to not-required"?
The chart is working fine (as you can plainly see from the attachment) but the labels aren't. Also, if I switch the same chart with the same settings to a bar or column or any of the others, the labels work great.
Comment #19
Scryver commentedIs it done with views or a block?
Comment #20
Pun-1 commentedOn mine I am doing it in Views
Comment #21
scottrigbyThis is going to be changing in the 2.x branch soon.
Comment #22
scottrigbyMoving this into the 7.x-2.x API issue component, where it is fixed. This should not be an issue with or without the Views UI, once #1674928: Allow full use of Highcharts library Options in Views is done.
Comment #23
ShedPhotons commentedIf you are seeing this in Easychart, the following worked for me. In the data table, let column A (leftmost) contain the slice labels, with the first row blank. Let column B contain the slice values, with the first entry being '100' (no quotes). The values should add up to 100. I don't know if this solution applies to the Highchart module.