Closed (fixed)
Project:
Google Chart Tools: Image Charts
Version:
7.x-1.1
Component:
Code
Priority:
Normal
Category:
Bug report
Assigned:
Unassigned
Reporter:
Created:
8 Nov 2011 at 01:35 UTC
Updated:
22 Nov 2011 at 01:50 UTC


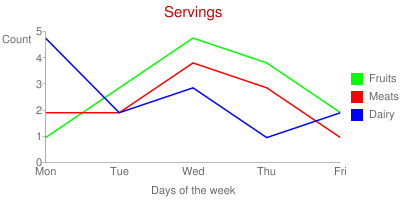
I'm not sure why but no matter what I do, there is a margin at the top of the chart that I can't get rid of. I attached an image of the line chart example to show what I mean. The y-axis goes from 0-5 and the highest point on both lines is 5, but the lines only reach about 4.8. I'd say about 10% at the top is not reachable by any line on the chart which means the chart is never accurate.
$chart = array(
      '#chart_id' => 'test_chart',
      '#title' => chart_title(t('Servings'), 'cc0000', 15),
      '#type' => CHART_TYPE_LINE,
      '#size' => chart_size(400, 200),
      '#adjust_resolution' => TRUE,
    );

  $chart['#data']['fruits'] = array(1, 3, 5, 4, 2);
  $chart['#data']['meats']  = array(2, 2, 4, 3, 1);
  $chart['#data']['dairy']  = array(5, 2, 3, 1, 2);

  $chart['#legends'][] = t('Fruits');
  $chart['#legends'][] = t('Meats');
  $chart['#legends'][] = t('Dairy');

  $chart['#data_colors'][] = '00ff00';
  $chart['#data_colors'][] = 'ff0000';
  $chart['#data_colors'][] = '0000ff';

  $chart['#mixed_axis_labels'][CHART_AXIS_Y_LEFT][0][] = chart_mixed_axis_range_label(0, 5);
  $chart['#mixed_axis_labels'][CHART_AXIS_Y_LEFT][1][] = chart_mixed_axis_label(t('Count'), 95);

  $chart['#mixed_axis_labels'][CHART_AXIS_X_BOTTOM][1][] = chart_mixed_axis_label(t('Mon'));
  $chart['#mixed_axis_labels'][CHART_AXIS_X_BOTTOM][1][] = chart_mixed_axis_label(t('Tue'));
  $chart['#mixed_axis_labels'][CHART_AXIS_X_BOTTOM][1][] = chart_mixed_axis_label(t('Wed'));
  $chart['#mixed_axis_labels'][CHART_AXIS_X_BOTTOM][1][] = chart_mixed_axis_label(t('Thu'));
  $chart['#mixed_axis_labels'][CHART_AXIS_X_BOTTOM][1][] = chart_mixed_axis_label(t('Fri'));
  $chart['#mixed_axis_labels'][CHART_AXIS_X_BOTTOM][2][] = chart_mixed_axis_label(t('Days of the week'), 50);

$displaychart = theme('chart', array('chart' => $chart));
| Comment | File | Size | Author |
|---|---|---|---|
| chart.png | 15.72 KB | ErnestoJaboneta |

Comments
Comment #1
13rac1 commentedThis is fixed in dev, #1248066: Margin added in _chart_adjust_resolution() breaks y-axis number alignment. Use the dev version for now.