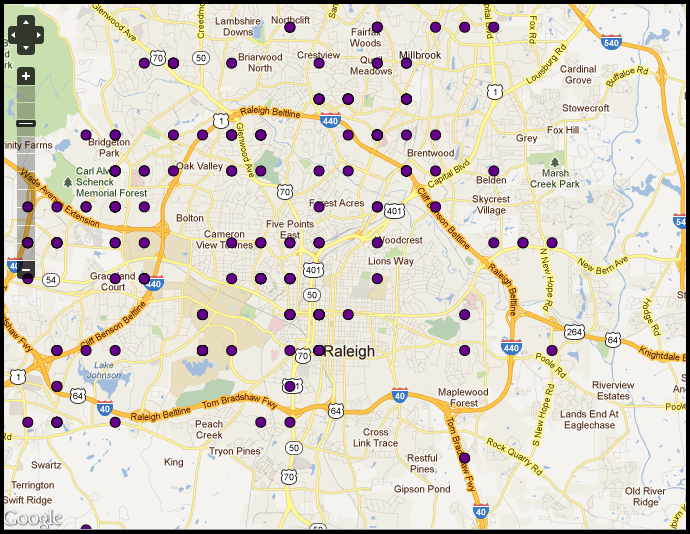
It's difficult to explain the issue without a screenshot, so please look at the image I've attached.
I have many nodes mapped on this map, and I've zoomed in to show that the nodes are plotted, not in their exact location, but rather in a grid-like pattern according to their latitude and longitude, and which point on the grid they're closest to. The result is that my maps look like a grid, and that many of these nodes' points are not even on actual streets or proper addresses when you zoom in. They're close to the node's location, but are plotted not in the exact location, but on this grid, in the closest possible corner.
Is this normal behavior for openLayers or am I missing a setting to get the plotted location to be more exact?
I'm not using a location field, but am creating this map from a view that uses a latitude and longitude fields I've created. The latitude and longitude are stored with a precision of 6/7 decimal points, so I don't believe this is due to rounding error. Any other ideas? Is anybody else experiencing the same problem?
Thanks in advance for any help or clarification...


Comments
Comment #1
nod_wow that's strange. It shouldn't happen because the projection on gmap is made with integers so there won't be rounding errors at this level either.
You have something online ? might help to see what's going on, because from here I have no idea.
Comment #2
ditcheva commentedHi nod_,
Thanks for your quick reply. Unfortunately, I'm working on localhost right now, and my site is not available online. This may actually be motivation enough for me to put it up online in a temporary location.
Before I can get that going though -- you're saying that it should be OK if I'm creating my OpenLayers views to be getting the latitude and longitude from two fields I have in my content type that are of type 'text' as long as they have an accuracy of 6 to 7 decimal points. That part at least shouldn't be an issue?
And there are no additional settings that may be affecting the display that you can think of? (I've searched thoroughly myself, and can't seem to find anything).
If the answer is 'no' to both of those, I'll work on getting what I have online as an example... Thanks once again.
Comment #3
nod_Oh you're not getting your values from geofield?
you might want to cast your data as floats before giving it to JS, this might be the issue.
Comment #4
ditcheva commentedYou know, I started by having those fields be floats, however, they were rounding off to 4 decimal places. So (since I could tell my points were not plotting exactly), I was worried it was rounding error and that's when I changed it to be a textfield (now it saves as many decimal places as I want).
I just did the test again, and it plots the exact same way with the latitude and longitude being either floats or text.
Here's an example of a location that I'm finding in google maps (right side of the image) and then where it plots in my openlayers map. I have pasted the exact latitude and longitude that the map from google maps gives me. You can tell that it's just plotting it to the nearest grid point (I've shown with arrows where that point should be and where it is actually plotted -- sorry if it doesn't make sense).
The next thing I'm going to try is using a geofield (I can only do that for testing, because it doesn't fit my long term project scenario, however). I'll update soon. :-(
Comment #5
ditcheva commentedUPDATE: when I use geofield, the mapping seems to be perfect!
So the issue seems to only be happening when I use the 'Lat/Lon Pair' from my own custom fields for the Map Data Sources in my OpenLayers Data Overlay.
At least we narrowed it down. It sounds like this may be more a bug than a support request, so I'll change the category for the moment.
Comment #6
nod_Awesome, indeed looks like a bug. That'll make it much easier to debug :)
Can you give the code you're using to display your data (views export and sample data) so that I can work on this?
Comment #7
ditcheva commentedI hope the below helps!!
Comment #8
zzolo commentedHi @ditcheva. Can you provide the Views Preview from the Views Data Overlay (it will be a variable dump)? Can you check that it is displaying the exact data that you inputted?
Also, your number settings on the fields might have something to do with it:
Comment #9
ditcheva commented@zzolo,
I did just look at the Views Preview and the lat and long fields are definitely the exact data I'd expect and are not rounded off problematically or anything.
However, I'm looking at the map again now, and can't seem to reproduce my original problem... I have two layers on my openlayers map. One that uses the lat/long textfield pairs and one using my geofield field (the way I've been doing things since I realized that solved my problem). At the moment, both seem to be plotting the companies properly. I've cleared cache and everything, but can't reproduce my original problem. If nobody else is reporting it, it may not be a big problem, and could have been a user error on my part somehow.
Comment #10
zzolo commentedWell, @ditcheva, it would have been nice to figure out what went wrong, but if we can't reproduce then that's ok too.