

Closed (cannot reproduce)
Project:
Visualization API
Version:
7.x-1.x-dev
Component:
Code
Priority:
Normal
Category:
Bug report
Assigned:
Unassigned
Reporter:
Created:
16 Apr 2013 at 14:08 UTC
Updated:
22 Mar 2015 at 14:17 UTC
Jump to comment: Most recent, Most recent file



Comments
Comment #1
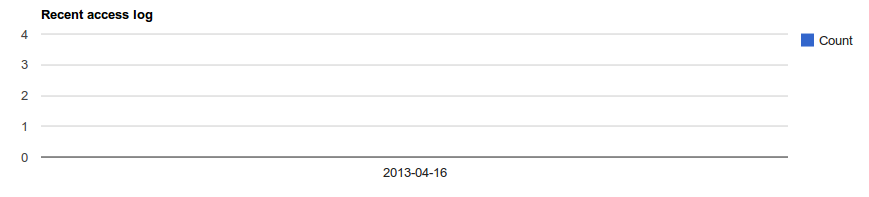
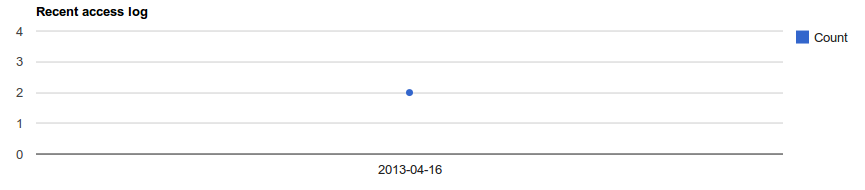
klausiAnd here comes a patch that adds $chart_options['pointSize'] = 5; if there is only one data row in line charts.
Comment #2
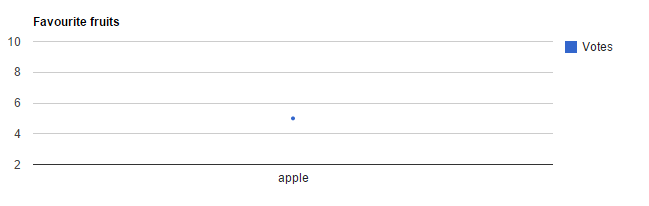
Niremizov commentedFor current version of Google's Visualization API (and for HighCharts also) i cannot reproduce such behaviour.
This is how it's look like:
