
Closed (fixed)
Project:
Google Chart Tools: Image Charts
Version:
6.x-1.x-dev
Component:
Code
Priority:
Critical
Category:
Bug report
Assigned:
Unassigned
Reporter:
Created:
11 Apr 2008 at 18:03 UTC
Updated:
6 Oct 2011 at 20:51 UTC
Jump to comment: Most recent file

Comments
Comment #1
tjholowaychuk commentedComment #2
xen commentedI've run into the same 0 value problem. I've fixed it by doing:
if ($v !== 'NULL'){
Instead of:
if ($v != 'NULL'){
In _chart_encode_data.
Comment #3
sivaji_ganesh_jojodae commentedpatch works
Comment #4
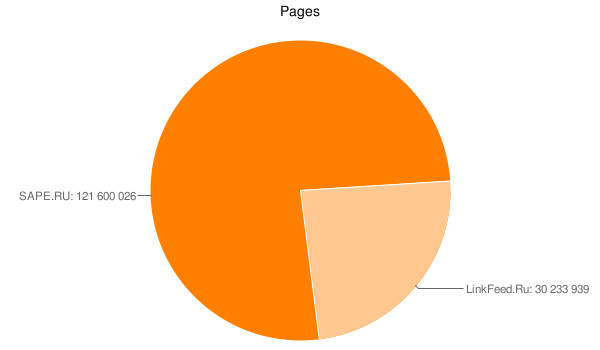
andyceo commentedI spend a lot of time to find why my pie diagramm is drawning incorrectly.
I have this data for diagramm (after adjusting resolution):
After
$data['chd'] = 't:' . _chart_encode_data($chart['#data']);in function chart_build($chart) in file chart.module in line 285, I have the following encoded data:And the diagramm looked WRONG.
After applying this patch in the file chart.module in line 384:
if ($v != 'NULL'){-->if ($v !== 'NULL'){Diagramm looks RIGHT.
So, please, commit this very needed patch!
Comment #5
andyceo commentedForget to change the version.
Comment #6
jeremy commentedSubscribe.
Comment #7
andyceo commentedDear boombatower,
please, commit fixes for that bug!
Comment #8
13rac1 commented#617194: Wrong data on chart after adjust_resolution is a dupe of this.
Additional patch located in: http://drupal.org/node/617194#comment-4859054
Comment #9
13rac1 commented