
Closed (fixed)
Project:
Storm
Version:
6.x-1.x-dev
Component:
Storm Task
Priority:
Normal
Category:
Feature request
Assigned:
Unassigned
Reporter:
Created:
20 Aug 2008 at 18:32 UTC
Updated:
15 Feb 2010 at 14:10 UTC
Jump to comment: Most recent, Most recent file

Comments
Comment #1
flickerfly commentedsubscribe - I'd like to see Gantt Charts also. It helps clear things up.
Comment #2
internetdevels commentedsubscribe
Comment #3
internetdevels commentedsubscribe
Comment #4
KrisBulman commented+1
subscribe
Comment #5
adam_b commentedsubscribe
Comment #6
abu3abdalla commentedsubscribe
Comment #7
hamsterbacke42 commented+1
and thanks for the effort so far, great module!
Comment #8
peterx commented+1 for Gantt, dependencies, and deadlines. I use Storm for new small projects based on Drupal, dotproject for some larger existing projects not based on Drupal, and have used a lot of other project management software. The really hard thing to explain to the decision makers is the fact that they set a deadline of 10 weeks but their decision making process will waste the first 9 weeks. Gantt charts and similar reports help explain how the timeline will become impossible.
If a customer pays for the delivery of the project in 12 weeks from now and the work will take 10 weeks, there is not enough time to put off the decision until the board meeting 3 weeks from now. The contractor cannot start the day after the board meeting, which means we need two contractors for 5 weeks instead of one for 10 weeks. Without that sort of reporting, some management will put off the decision until the second last day then expect you to complete 10 weeks work by using 50 contractors for 1 day.
There is a Gantt component for Jquery at http://www.maro-z.com/examples/jquery.gantt/. A PHP component would be better because the output could be converted to several forms using the Drupal module for converting output. The dotproject gantt code might be a good starting point.
Dependencies are harder because you can have a range of possible resources. We have several contractors lined up for one project and each week one of the contractors calls to say he or she is now booked out for weeks or months. At times I explain to people that module B cannot be started until module A is finished because module B requires the output from module A. Some manager gives me a blank look then says ok, but module B has a higher priority so do not start on module A until after you finish module B.
Deadlines are easier. You type in the IP address for every computer belonging to the decision making management and set the deadline. When they fail to make the decision at the critical time, call the Drupal High Tension API to send a 20 thousand volt reminder through their keyboards. :-)
Comment #9
adam_b commentedWhen they fail to make the decision at the critical time, call the Drupal High Tension API to send a 20 thousand volt reminder through their keyboards.
Ooooh! I like it!! Can this be split off as a separate function?
Comment #10
flickerfly commentedProbably should use the status module to assure they are at the desk before the voltage is called upon. :-)
Also, some great ideas on the Gantt stuff. Neat that a jquery module exists.
Comment #11
Roberto Gerola commentedThanks for the jquery suggestion, but I think Strom we'll need also other charts, so
I think to integrate http://www.aditus.nu/jpgraph/ library.
Gantt examples : http://www.aditus.nu/jpgraph/features_gallery.php#GanttPlots
Comment #12
peterx commentedThere is a free version but it cannot be used in sites that charge for use of the site. Is there a free graph library anywhere?
Comment #13
peterx commentedGood old sourceforge:
http://graphpite.sourceforge.net/
http://pchart.sourceforge.net/
Comment #14
masood_mj commentedsubscribing
Comment #15
Anonymous (not verified) commentedsubscribing
Comment #16
pitxels commentedsubscribing
Comment #17
Macronomicus commentedI like that pcharts... It even charts live data, plus its pretty.
Still cant help but think flash charts would be better cause there a little more dynamic with dialog pop-ups n stuff.
http://teethgrinder.co.uk/open-flash-chart/
Anyone here using Storm in production? ...or close?
Comment #18
Magnity commentedIt looks from my preliminary inspection that JpGraph is the only graph library out of the ones mentioned that natively supports Gantt charts (or perhaps I missed it). Although I do understand that most users will probably be using Storm in a commercial sense - and will probably not want to pay 85EUR for a professional license.
I think the first step along the way though is to introduce the idea of dependencies into tasks.
@macrocosm: Please see http://drupal.org/project/usage/Storm - there are currently about 450 reported users. This doesn't report on whether it's being used in a production sense, but I know of several cases where it is, and also have seen many users imply that they are within other issues here.
Comment #19
danepowell commented+1 subscribing
Comment #20
figaro commentedSubscribing. In the meantime, perhaps a coding wizard is able to pull data from the tables and feed it to a google charts:
http://www.designinginteractive.com/code/how-to-build-a-gantt-chart-with...
Comment #21
Radiating Gnome commentedsubscribing
Comment #22
homoludens commentedi'm also looking for solution and have found: http://www.jsgantt.com, it's under BSD license, but author is willing to change it if you (we) ask him to: http://www.jsgantt.com/#tLicense, so you could include his code in module.
i have tried using google charts, but after making them half working - i started wanting interactive chart, so that user can click on chart to go to specific task - and change it.
Comment #23
Magnity commentedWe don't need to include the code in the Storm release, as it can be included as an external library similarly to how the tcpdf library is used in Storm Invoice. The reason that a previous library was debated was because a lot of Storm installations will be used for commercial purposes.
This one could be a good solution though - who volunteers to make a patch? Otherwise it will stay on my 'list of things to do'...
Comment #24
homoludens commentedi have some kind of working copy, and will try to make some not-too-much-embarrassing patch during weekend. i will have few questions, about what is best to do, but we can tall about it after i post a patch.
Comment #25
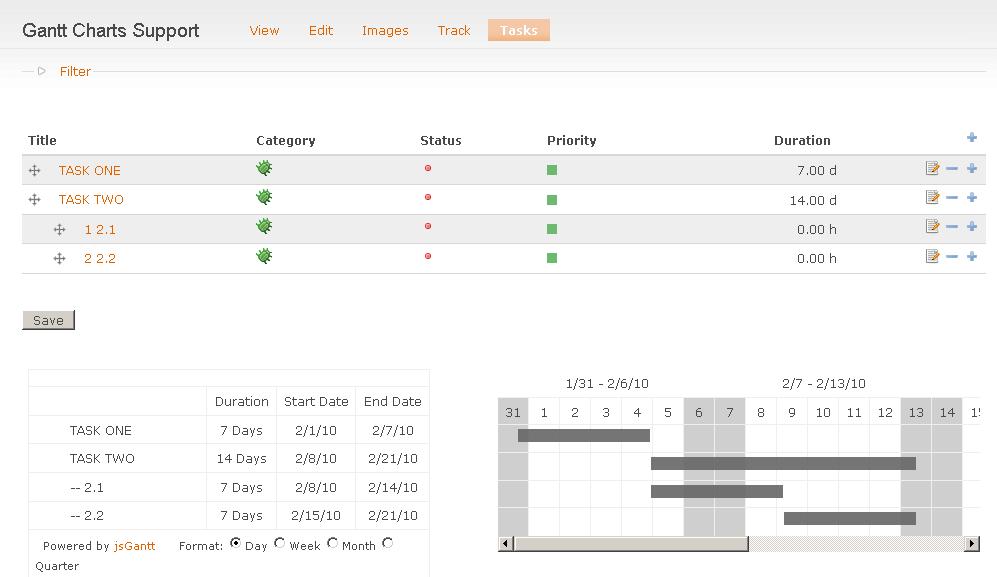
homoludens commentedhere is the patch against latest dev (2009-Jun-28). all changes are in stormtask.admin.inc file, and gantt chart will appear below task list (task tab of project). here is screenshot:
http://twitpic.com/8og8k
this is only basic functionality. i still need to find out is "Step No." in storm is the same as "Group" in jsgantt. and is "Parent task" in storm is "pDepend" in jsgantt. and to implement that.
there is need for admin interface to choose visible fields, colors, and maybe file caching - jsgantt can use xml file as input, and we could make it right after crating/updating task in project. i need input from other users for this things.
this patch assumes that you have directory "sites/all/libraries/jsgantt" and inside it files jsgantt.js and jsgantt.css from file jsgantt.zip:
http://www.jsgantt.com/zip/
there are few quirks with css witch is generated in javascript, so i'm not sure how to fix them without changing jsgantt.js?
Comment #26
Magnity commentedThanks @homoludens, @all - please review!
I will be testing it out properly myself when I get a minute.
What i'd suggest for now is that we include a setting in StormTask - "Enable Gantt Charts (experimental feature)", so that we can include some of this code in the -dev version and allow people to test it more easily. Also then add in more of the functionality as and when it is completed.
Re dependencies, parent tasks, groups etc. I suspect the parent tasks are better to use to generate groups. Dependencies will need to be added into the tasks - as far as I understand it, the hierarchical nature is simply to group tasks together and there is nothing in Storm at the moment that records which tasks depend on others.
Comment #27
homoludens commentedi have added some basic admin controls at admin/storm/tasks. it is possible to enable/disable gantt chart, to choose another directory for jsgantt.js and jsgantt.css - here i'm checking if file really exist, so testing that is recommended.
I have also added options to choose color of charts, enable/disable display of dates and duration in table.
please, try it out and report.
patch is created with:
and you can apply it from storm directory with
i'm not sure if that is the right way to create patches of multiple files?
Comment #28
Magnity commentedOK I've just tested the patch in #27.
First of all - on first install at the moment with latest -dev you will see a php error - which is because I added in some admin settings last night. To make it easier for this, I have got rid of that for now so we can test this more easily.
The things that need working on:
- Task durations - currently anything in hours comes out wrong on the Gantt chart, a zero length duration.
- Dependencies shoot all over the place at the moment - I think also that the parent task should not be used for dependencies but for grouping.
- The width of the chart - goes off the page - is this what you were talking about with the css?
- On clicking on the task, a popup is opened - is it possible to open the link in the same window?
- A minor point - with the admin_settings and menu links, we should refer to "Storm Task" in the singular as that is the precise module name.
Nice start though!
Comment #29
homoludens commentedi haven't even though of hours. i guess i don't use them, but will look that up.
on the other hand, i don't even use filed "Duration: " for making charts. mostly because i don't understand why we need both "Date end:" and "Duration:"?
i tried that, and i looks kinda strange, because you see that task like black line and all other are blue - but distinction in storm is not that obvious. it is especially strange if child have it's own children. definitely something i should think about. will try to fix it.
exactly that. i have changed it in mine local jsgantt.js, so it's ok for me. not sure what is the best solution for that.
i have changed line 481:
to:
so at least i know how big that table will be. i hope that i/we will find better solution.
yes. almost forgotten that one. most annoying, that was the first change i have done to jsgantt.js line 1445:
these are problems that i saw, and i hope i will find solution in few days. every input is very much welcomed.
Comment #30
Magnity commentedPerhaps the Storm fields could be changed so that duration is simply calculated by [date end] - [date start]. Alternatively, perhaps we could set the task from [date start] and [duration], and use date end as [due date].
It may be a bit difficult if we're making changes to the jsgantt.js file - ideally we'd either be able to override bits in some way or then host the library as part of the package... but then come the license issues... it would have to be released as GNU GPL...
Comment #31
homoludens commentedmy thoughts also. 2 of those 3 field are enough - third should be calculated from other two. ideally it would be nice that user can use whichever field he/she wants, but mine experience is that i shouldn't let them choose - it is confusing, and they hate it.
i believe it is better to to leave only date fields and to calculate duration. that is more usual approach, and user would have to look at calendar and check for weekends and stuff. and at the end he will even see duration in days, yuhuuu! :)
about jsgantt.js. it is bsd, but if we can not find better way to override some code, we can ask original author to give it to us under gnu glp. he is open about that, so maybe we can get permission. or maybe, even better, he has some ideas how to solve our problems.
i will write to him and ask him both questions. mine preferred solution is to leave it as separate library, so we wouldn't care about that development and fixes.
Comment #32
homoludens commentedthis is patch against last dev (2009-Jun-29), with changed name of tab to "Storm Task".
Comment #33
Magnity commentedPlease could a few of the people who were calling for this feature review the patch?
I'd say its pretty close to going in - bar the problems with changing jsgantt.js...
Comment #34
homoludens commentedi have received, (btw. very fast response) from jsgantt developer:
me: 1. one problem is that JSGantt.taskLink opens link in new window, and we would
prefer opening in the same window.
Shlomy:
me: 2. width of produced table is to big and goes off the screen
Shlomy:
so we can change the code and include it in our download. or better - make a little fork which works for us and put it on some website (your, mine, some other...).
and then if and when they fix it we will start using official lib. until then we will recommend original release.
for now i will attach mine version of it here.
Comment #35
Magnity commentedOK - I'd suggest then we add a folder jsgantt inside of the stormtask folder with:
- The relevant js and css files
- A note explaining that they have been released under the GNU General Public License and giving the modifications that we've made. This might be easier in fact to provide a patch file from the original to the modified in a separate file. This way we can still give credit to the original library code.
The fact remains though - that there are about 15 people who have subscribed to this issue who haven't tested the patch - all i'm looking for is a couple of people to give an opinion on it since it could be a really great piece of functionality if it works properly.
Comment #36
Magnity commentedjsGantt library is now in CVS.
An updated version of the patch is attached.
Comment #37
Magnity commentedI've committed up to the latest patch for this:
However Gantt chart does not line up with labels - there may be other issues still but I wanted to get the code in other changes make the patches even more useless (they already needed a few edits to apply properly).
Comment #38
homoludens commentedit will certainly be easier to fix it once it is in. It is already taking to much time to make it work with every -dev.
and about chart and labels, try adding:
to jsgantt.css, it sholuld fix the issue.
usualy drupal themes have 1em margin for tables. this should override it only for gantt chart.
Comment #39
Magnity commentedYes - that solves the layout issues and committed.
So other issues to resolve
- Durations / including the more central issue of start/end/duration consistency.
- Dependencies
I'm happy if not all of these are committed before 6.x-1.24 (in fact that may encourage a few more people to comment), but in that case they'd need to be neatened up a bit - for example perhaps all dependencies hidden for now. But that's something I can do pre-release.
Comment #40
homoludens commentedI am thinking of ways to use grouping and dependencies. Right now, in mine installation, I'm using Step No. for grouping, and Parent task for dependency. And it feels ok. Problem is that Step No. is simple text field, and not selection box.
Another way would require adding task module Dependency field, and using Parent task for grouping. Basically, same type of field - only different name. But then, I do not understand need for Step No. field.
Is that your idea? Or if you have something other in the mind, you can explain.
Duration is another problem, I have "solved" it with patch in this post: http://drupal.org/node/315455#comment-1784038
Where Duration field is disabled, and I'm thinking to add datetime field instead of simple date for start and end - so duration can be in hours, not only days.
Other ideas?
Comment #41
recrit commentedwith regards to the duration and date end..
It would be useful to do away with the duration field and then have a planned date end and a actual date end. Then you could make a simple flag for 'Overdue'. Might be more complicated to incorporate this in the gantt chart, but a simple flag in the task table would be a good start.
Comment #42
recrit commentedI have tested the gantt charts in 6.x-1.x-dev 2009-07-14.
Bug:
Make it pretty solutions
Great work on this! This is exactly what I was looking for. I'm fine with looking at tables, but clients like pretty charts!
Comment #43
Magnity commentedI've committed your aesthetic suggestions. #2 doesn't display very well - needs work - it cuts off the RHS of the Gantt chart, but it does work better than the existing.
Having trouble getting the script to work with
drupal_add_js(inline) - would you be able to post the changes you made for this?Thanks,
Comment #44
recrit commentedpretty #2 -- I ended up going back to 'overflow: auto;' and then widened my fixed display so the 2nd horizontal scroll for the whole chart doesn't show... this is more specific to my design.
drupal_add_js -- I closed off the div string on line 128 of original version and then added the drupal_add_js around the inside content of the script tag with argument "inline" (code block shown below).
Comment #45
recrit commentedI have added some more features to the chart:
You had a comment by the pColor for task status, perhaps this is along the lines of what you had in mind. The rendered chart is very easy to see overdue tasks, completed tasks, etc. It would be nice to also be able to theme the label on the chart, since once you scroll passed the bars you don't see the colors... i didn't see any easy hook into jsgantt to accomplish this.
All code changes are lines 112-159.
Comment #46
Magnity commentedI'm finding it quite hard to apply the changes (and judge between before/after) - any chance of posting diff patches for the last few changes? They look like they might be quite useful.
For some reason also, whenever I use drupal_add_js, the gantt chart does not display for me - it may be something i'm doing wrong, but i'm hesitant to commit this bit until I've figured out why.
Thanks,
Comment #47
recrit commentedi have attached the combined patch for stormtask.admin.inc and stormtask.module - these are off of the latest dev with datestamp = "1248481692" (Sat, 25 Jul 2009 00:28:12 GMT)
Also attached is a screenshot of what the chart looks like with the colors.
For the drupal_add_js: on your test site, is the jsgantt.js library getting loaded before the inline script thats added from drupal_add_js?
Comment #48
recrit commentedfound a small bug..
I had a task name that contained a ' and this caused a missing quote error in js. I was able to fix this by changing the name to check_plain($task->title). I did not see any other jsgantt parameter that would need escaped since most are numbers and not user input.
Comment #49
Magnity commentedI've added that check_plain - thanks.
In progress with testing the other changes - getting malformed patch if I apply it so going to have a look manually.
Comment #50
homoludens commented@recrit: you have done exact changes that I had on mine todo list. :)
thank you.
I will test it and report if I find problems, but code looks fine.
Comment #51
recrit commentedMagnity - sorry about the patch.. its most likely from when I combine the 2 file patches. I have attached each patch for the files. This is still off of the dev from 1248481692
Comment #52
Magnity commentedI've committed those colour changes.
Although I still haven't managed to get the script working using drupal_add_js, so haven't put that in yet. I'll give it another go soon. I'm testing on the demo site, which is a fairly basic install - so i'm a little confused as to why it isn't working...
Comment #53
konnichiwa-japan commentedHello, I have downloaded and installed version 6.x-1.24, which in the documentation is said to have support for Gantt charts. I assume that this means that as of the August 21st release of version 6.x-1.24 the Gantt charts patch has been included with the release. However, I cannot seem to find how to activate this feature. I have searched through everything and cannot find any reference to Gantt charts except for in the release notes. Is it still necessary to apply this patch in order for it to work? Could we get some documentation on how to use this feature please? And perhaps some screen shots? Thank you.
Comment #54
Mark_Watson27 commentedActivation should be via settings for Storm Task and to see the gantt chart go to the Tasks tab of a Project node.
I would suggest that this should have been a seperate post for the change in category and version but I'll let @Magnity decide.
Thanks
Mark
Comment #55
Magnity commentedFine to ask support questions on the relevant thread - but no need to change the category etc. Not a massive deal though.
Comment #56
orachooon commentedthank you .It my loking for.
Comment #57
summit commentedSubscribng, greetings, Martijn
Comment #58
iamjon commentedSubscribng, Martijn thank you for maintaining this wonderful module
Comment #59
cdavis122 commentedThank you for creating and maintaining a great module! I am new to drupal so far I love it.. Storm is great to but for the life of me I don't understand how to make the gantt charts visible. Can someone point me in the direction of the directions or give me a quick how to. thanks.
Comment #60
gulliverrr commentedTo cdavis122:
install the 6.x-1.30 version of storm and navigate to any project with tasks. Then select the tab on the right that says "Tasks"
If you project has nodeID for example 123 then navigate to
/node/123/tasks
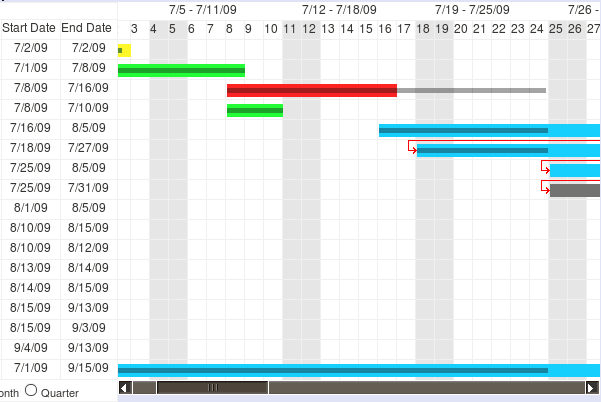
you should see the gantt chart at the bottom (see screenshot). There are still some issues but it is functional and not very far from something we can all use. For anything else, just ask
Comment #61
Magnity commentedMake sure you enable it also at /admin/settings/storm/task
Comment #62
gulliverrr commentedI forgot about this :) By default it is disabled, so yes you need to enable it first...
Is there a known issue (as I cannot track it down) with the display of the bars in the gantt chart? Length-wise, they look ok but they are misplaced by some days? See screenshot (and textual dates on the left) from my previous comment (#60) or here too:
http://drupal.org/files/issues/gantt-6.x-1.30.JPG
Additionally is there any way to show a common Gantt chart for different projects/tasks or all together in one timeline (1 Gantt chart)?
thanks for your support
Comment #63
Mark_Watson27 commentedI was having the same issue, so I've just used FireFox and FireBug to trace what was going on and it turns out to be padding on the table cells coming from the theme.
You'll need to incorporate the following in your CSS
Maybe this should be included in the CSS installed by Storm for the Gantt Chart.
Comment #64
gulliverrr commentedIf only I was a bit faster :) Thanks!
I could tell it was a theming bug and especially for Garlnad as Bluemarine, Chameleon and Marvin were working fine.
Above CSS fix works fine for Garland and yeap definitely is needed to be added in the CSS installed by Storm.
Are dependencies working? That means not only the little arrows in the Gantt Chart but also the UI to set dependencies between tasks unless this is done by setting "parent task".
Comment #65
Magnity commentedAny volunteers to put that into a patch?
Comment #66
gulliverrr commentedI will try that now. The code is from Mark_Watson27 @#63 but as I havent used CVS before it will take a little longer than usual for a simple addition. Please review upon submission
Comment #67
gulliverrr commentedThere you go...
please make sure its format as a patch file is ok.
Done it with WinMerge from Windows for the first time.
Comparing it with other patch files, looks right.
Comment #68
gulliverrr commentedHmmm... code change is already placed in the latest dev tarball and is actually in the most appropriate file:
\modules\storm\stormtask\jsgantt\jsgantt.css
so no need to add my patch above if you use the dev version.
Comment #69
Magnity commentedOdd, I can't remember committing any changes to the Gantt section recently.
Can you confirm that with the latest dev the problem goes away as well? It may be that the css is there, but not being included or something.
Comment #70
cdavis122 commentedThanks for all your replies I check all of the items suggested above and I do not get a gantt chart anywhere. I have the 6.x-1.30 version and I have gantt chars enabled but I get nothing. I added
#GanttChartDIV td,th {
padding:0 !important;
}
to the css file but it didn't help with viewing the gantt charts. What theme works best with storm? Maybe that's my problem. Any other suggestions would be most helpful.. Thank you.
Carla
Comment #71
cdavis122 commentedI figured it out it looks good! I am so happy this module rocks!!! :-) Thanks for everyones help...
Comment #72
summit commentedCould you also tell what you did to get it fixed please?
greetings, Martijn
Comment #73
gulliverrr commentedAs far as I know, using Garland the required steps are:
1. Use latest .dev package (http://ftp.drupal.org/files/projects/storm-6.x-1.x-dev.tar.gz - by Roberto Gerola - May 1, 2008 - 14:21)
2. Check file:
storm\stormtask\jsgantt\jsgantt.css
contains (at the very bottom)
#GanttChartDIV table{
margin:0;
}
These lines just fix a styling issue that Garland has. Even without these lines the Gantt charts should appear. Read below as I think I found your problem...
3. Enable Gantt Charts.
@ admin/settings/storm/task select "Enable Gantt Charts (experimental feature)"
AND HERE IS A BUG I FOUND!!!
4. Go to a Projects page with a few tasks under it.
You should see two "Tasks" links. One as a tab at the top and one as an Icon & Text on the right
The first takes you to:
/node/[your_project's_nid]/tasks
where you should see the tasks as a Gantt Chart at the bottom
The second takes you to:
/storm/tasks/?project_nid=[your_project's_nid]
where you see NO Gantt Chart!
I dont think its any URL_aliases setting. Its just a bug. Can anyone else please confirm this so we can list it as a bug.
At the moment Ive hidden temporarily the problematic Icon & Text link by modifying storm\storm.css to:
dt#stormtasks {
background: transparent url(images/tasks.png) no-repeat top left;
display: none;
}
Comment #74
Magnity commentedRe #73 point 4 - this isn't a bug, just a bad ui. There are a few other ui issues open that should cover it.
---
This issue was getting unweldly, so I've split it into:
#701286: Refactor Gantt chart system
#701288: Add dependency information to tasks and Gantt charts
#701298: Gantt chart should use drupal_add_js()
I thnk that covers most outstanding points, so please do not use this issue from now on. The best way is to use the ones above or create new issues.