I have the following to create a horizontal bar chart
<?php
$chart = array(
'#chart_id' => 'test_chart',
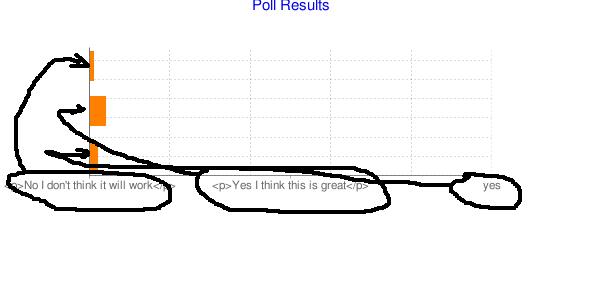
'#title' => chart_title(t('Poll Results'), '0000ee', 15),
'#type' => CHART_TYPE_BAR_H,
'#size' => chart_size(300, 400),
'#grid_lines' => chart_grid_lines(20, 15),
'#bar_size' => chart_bar_size(30, 15),
);
$sql = "SELECT count(data) as count, data as label FROM table group by data";
$results = db_query($sql);
while ($result = db_fetch_array($results)){
$chart['#data'][] = $result['count'];
$chart['#labels'][] = $result['label'];
}
$chart['#data_colors'][] = chart_unique_color('test_a');
echo chart_render($chart);
?>
which works fine - except that the labels come along the bottom ie x axis, rather than along the y axis. Image attached.
Any ideas how I get the labels moved? thanks


Comments
Comment #1
tjholowaychuk commentedHello please check out this wiki page http://code.google.com/p/drupal-chart-api/wiki/Examples
the section "Line chart, legends, resolution adjustment, and label positioning" should help
Comment #2
Anonymous (not verified) commentedGotchae - its the mixed axis - even though its not mixed ;) - thanks
Comment #3
Anonymous (not verified) commented