
Closed (fixed)
Project:
FusionCharts
Version:
6.x-1.x-dev
Component:
Documentation
Priority:
Normal
Category:
Support request
Assigned:
Reporter:
Created:
23 Jan 2009 at 15:07 UTC
Updated:
10 Jun 2011 at 10:29 UTC
Jump to comment: Most recent file

Comments
Comment #1
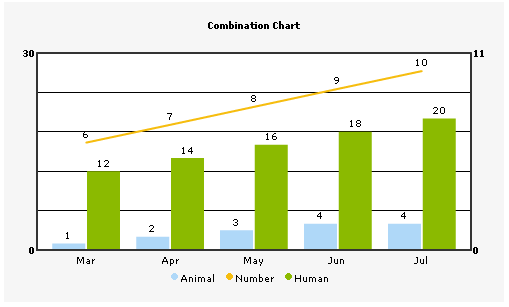
aaron1234nz commentedThe Multi-series charts are the least tested of the graph types. I have put in some data validation and data reshaping routines into the latest release which should make it easier and more robust when entering data.
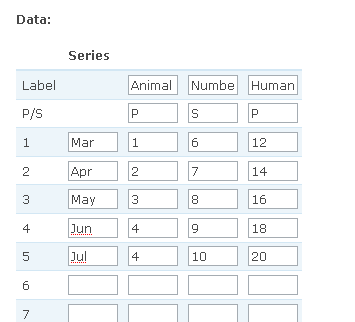
P/S stand for Primary or Secondary axis. Enter 'P' of the data should be shown on the primary axis 'S' to show in on the secondary axis.
Attached is a sample chart and corresponding data which you can use as an example. I will get around to documenting this properly one day ;-)
Comment #2
aaron1234nz commentedComment #3
aeserran commentedand, in the code? I have this code:
How can i define the 'P' or 'S' axis?
Thanks!!
Comment #4
aaron1234nz commentedIt's possible to do a Dual axis chart from a SQL query I'm afraid. Try selecting the data, processing it, then return it as $info->data. Checkout the fusioncharts.test module for an example.
I've updated the documentation on how to construct the data attribute for all charts also.
Comment #5
aaron1234nz commented