Every call to hook_term_path() calls taxonomy_vocabulary_load(), every call to taxonomy_vocabulary_load() calls taxonomy_vocabulary_load_multiple().
On my test site, front page, 300 nodes, each with taxonomy terms (via devel), taxonomy_vocabulary_load_multiple() is called 1796 times, this equates to 260ms self time (so actually not expensive per call, it's just the number of calls slowing it down).
While there's a static cache, the tripled function calls (there's more than that including _multiple() internals) is a waste.
Attached patch uses drupal_static() to access the cache of taxonomy vocabularies taxonomy_vocabulary_load() too.
While 300 nodes on a page isn't very realistic. A list of several hundred taxonomy terms seems fairly likely on some sites. 5% performance improvement for 3 lines of code.
HEAD:
0.35 [#/sec]
Patch:
0.37 [#/sec]
This is something we might want to do consistently for _load() vs. _load_multiple() functions and it's one of the benefits of having a central static caching mechanism. However starting with this as an example.


Comments
Comment #1
catchComment #2
moshe weitzman commentedIMO, this is a questionable tradeoff. I would rather the multiple function look after its own cache and it not be used directly by other functions. This just saves a function call. I am surprised that we'd see a 5% gain just by removing simple function calls. How many requests did you run?
Comment #3
catch100 requests on the last round.
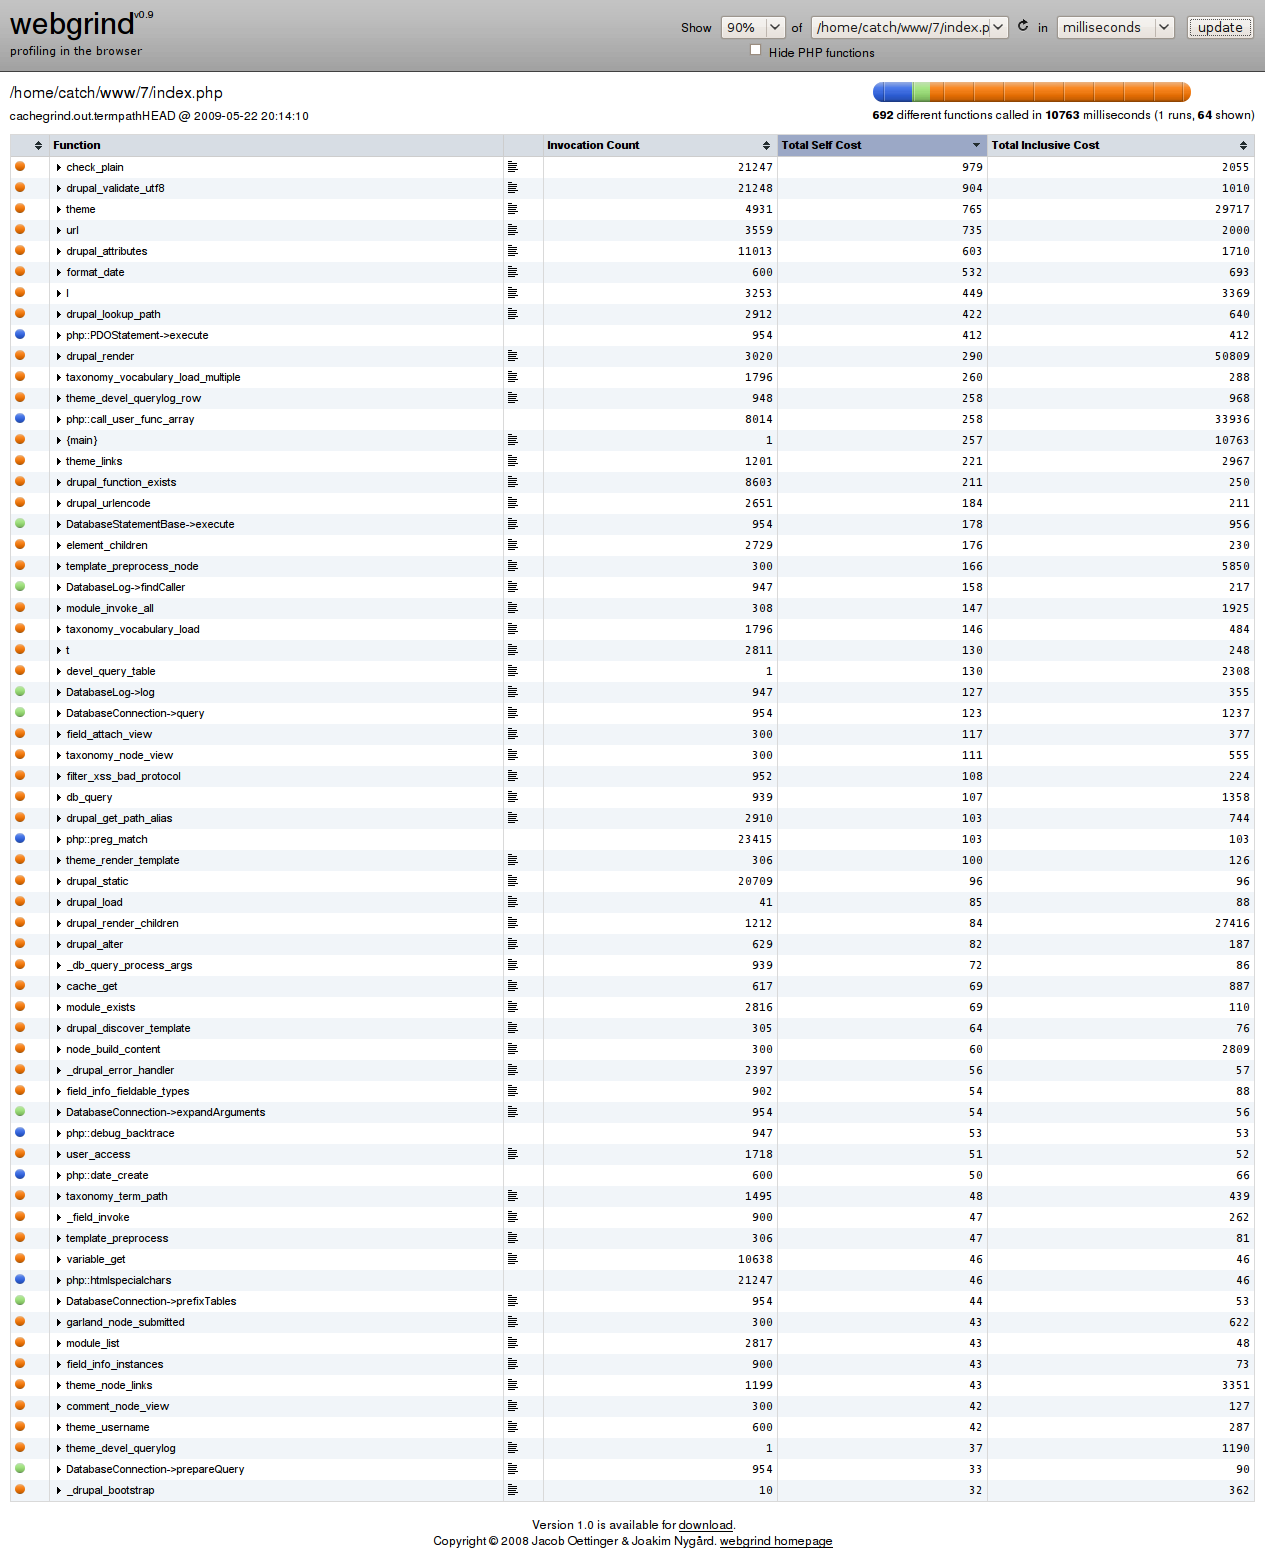
Here's cachegrind screenshots on one request - the functions called by _multiple() take approx 28ms, leaving 260ms for time in self. When patched, taxonomy_vocabulary_load() takes 60ms total, _multiple() is called just a couple of times obviously so not even visible on a 90% view. Admittedly the whole request takes 9,000ms when profiling, but still.
Same patch, 500 requests. Comes out as 2.5%.
HEAD:
0.40 [#/sec]
Patch:
0.41 [#/sec]
Comment #4
catchDiscussed this with Damien in irc last week. This is only measurable when taxonomy_vocabulary_load() is called hundreds of times - but that's quite possible on a node listing (or a view of taxonomy terms or something). Basically taxonomy_vocabulary_load_multiple() has to do some additional checks to make sure it's retrieving everything from the right place and returning it in the right order whether it gets one vid or 10 - and there's no good reason to add special casing to 'return one vocabular from the cache' within that function itself - would just be ugly. But with a line of code in _load() we save a lot of function calls and a bit of messing about when there's all these repeated function calls. Same patch again, but with better comments.
Comment #6
pwolanin commentedSubscibing: we really need a good terminology/mental framework for how to treat these vars - in a way they are our substitute for instance variables if Drupal was one big object. I think it's a little funny to use them this way, but I appreciate that it's in a read-only fashion.
Comment #8
catchComment #10
catchThere's an entity API issue for this somewhere, and hook_term_path() is dead, so closing this out.