
 Come together with the global Drupal community in Rotterdam, 28 Sept – 1 Oct 2026. Sessions, contribution, connection, and Early Bird savings until 8 June.
By andremolnar on
Dries has done some benchmarking..
The discussion on the development mailing list boils down to:
We've got to improve non-cached performance if Drupal wants to remain competative.
(because its easier for other products to improve their caching and catch up on the front).
So where do we start? What does the code profile look like? Where are the bottlenecks?
Attached are a couple of profiles from my laptop serving the default front page (/node) from localhost.
The first is a stock 4.7 install. The second is an up to date (Aug, 17th 2006) CVS checkout.
Certainly more profiling needs to be done (not all pages are created equal in Drupal), but this is a starting point.
Draw your own conclusions from the results.
andre
| Attachment | Size |
|---|---|
| profile.png | 66.32 KB |
| profileCVS.png | 42.79 KB |
| performance.png | 1.1 MB |

Comments
Caching issues - back button always contacts server
Will these changes help with the problem of the lag time in a registered user returning (via 'back', for example) to a page s/he's already visited?
I describe this in more detail at this thread http://drupal.org/node/79167
Questions
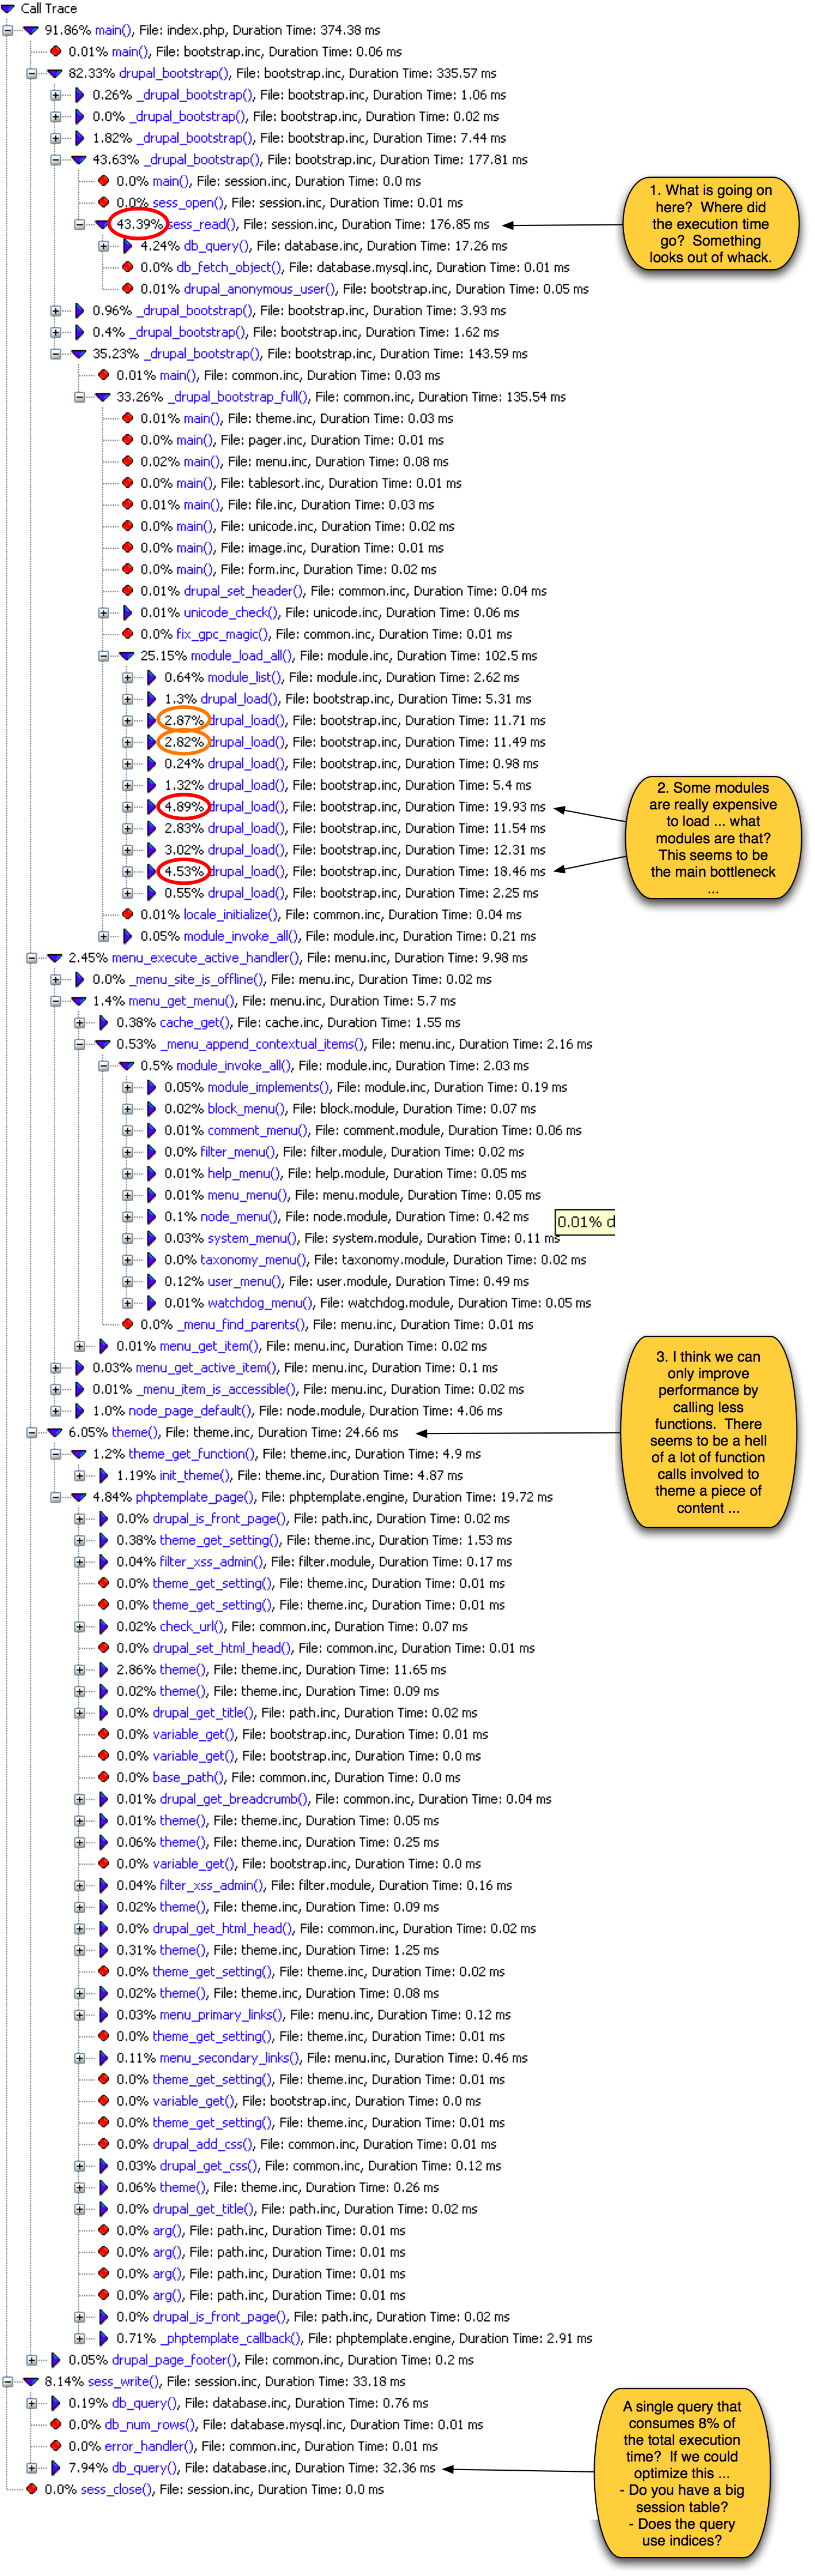
I attached an annotaded png: http://drupal.org/files/performance.png.
(Can we move this to an issue so we can attach images properly?)
Issue Created
http://drupal.org/node/79224
More Questions
How can I generate these sorts of graphs myself? I want to do code profiling on my own Drupal installation and I don't even know where to start. I have about 30 modules activated, and I use features of all of them, but I need to know which ones are slowing down page loading time the worst. I don't even know where to begin to get that kind of info. I get (at best) page load times of around 700-800ms of server time (according to the Devel module), and at worst about 4s. Thanks for your help!