

Closed (fixed)
Project:
Drush
Version:
All-versions-3.x-dev
Component:
Documentation
Priority:
Normal
Category:
Support request
Assigned:
Unassigned
Reporter:
Created:
16 Jul 2010 at 15:42 UTC
Updated:
16 Jul 2013 at 20:49 UTC
Jump to comment: Most recent, Most recent file



Comments
Comment #1
moshe weitzman commentedMostly, this requires a lot of patience and googling. You have to get xdebug (i.e. php.ini for the CLI) and the netbeans client setup properly. One tip is to setup netbeans so that it does not open a browser window when starting a debugging session. Its in an advanced tab.
Also, use Xdebug 2.1 Final release as earlier releases had problems.
Useful commands:
php --ini
php -i | grep xdebug
my php.ini has
Try to turn on logging by changing the last line and see if you get any useful info. Note that you can fiddle with php.ini and retry quickly since apache is not involved and thus nothing needs restarting.
Let us know if you get it working.
Comment #2
simeThanks for sharing your settings! If I get this going I'll reply back.
Comment #4
simeI have just recently got this working. Here are my steps that should get a person up from scratch debugging drush CLI. This is not a polished guide, and I'm not sure if I've missed anything, but I welcome anyone who wants to create some documentation based on this.
Applications
MAMP free 1.9.4 (xdebug included)
Netbeans 6.9.1
Configure xdebug
In my installation, php.ini is in
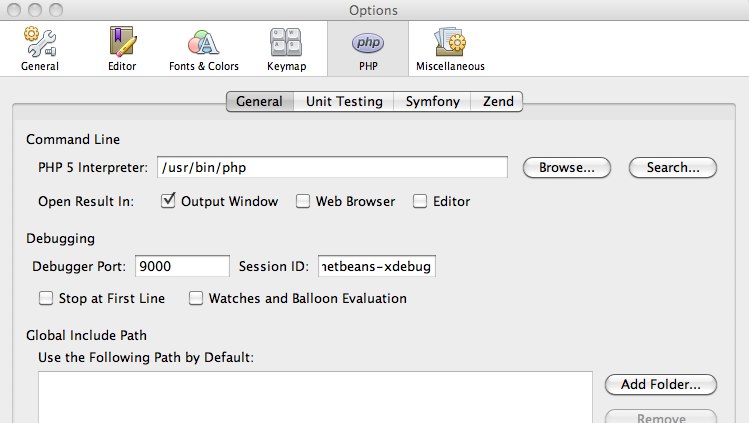
/Applications/MAMP/conf/php5.2/php.ini. I found the commented-out reference to xdebug, enabled xdebug and added the following lines.Note that in the screenshots below, you'll see I reference
/usr/bin/php. By default this is whatever ships with OSX. I personally move the OSX php out of the way and symlink /usr/bin/php to the MAMP version.Netbeans config
Fig. 1 - Netbeans -> Preferences.
Create a project
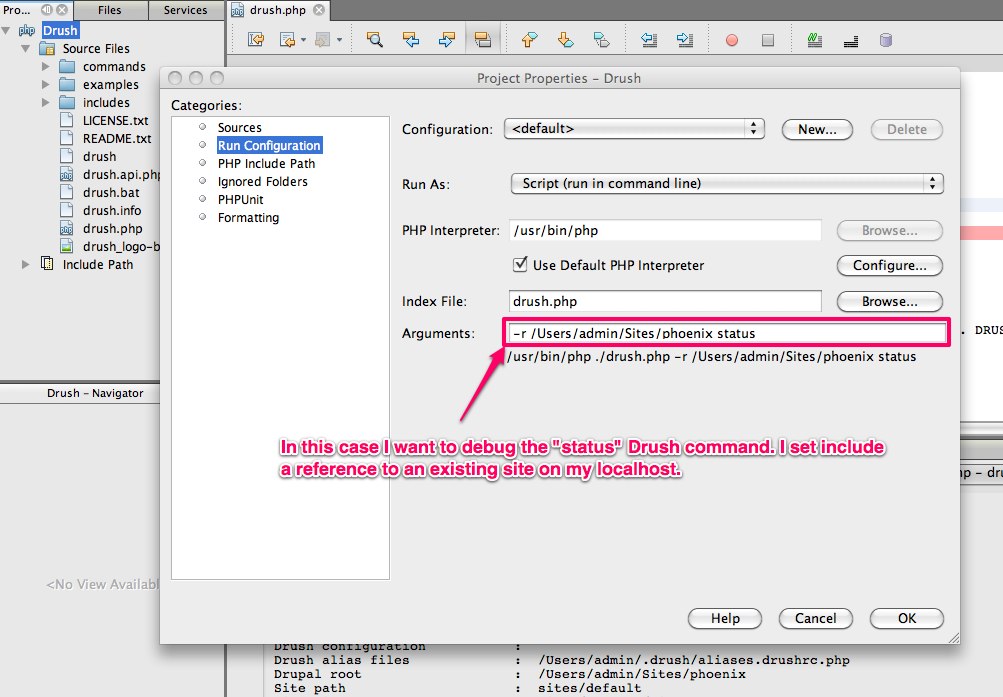
I then created a new project in Netbeans, with the root directory of the project being where Drush lives (although I have a feeling it doesn't matter where the root is). Once the project is created, right-click on the Project name in the side-bar and select "Properties". The following screenshots show the two applicable settings pages.
Fig. 2 - Project properties: sources.
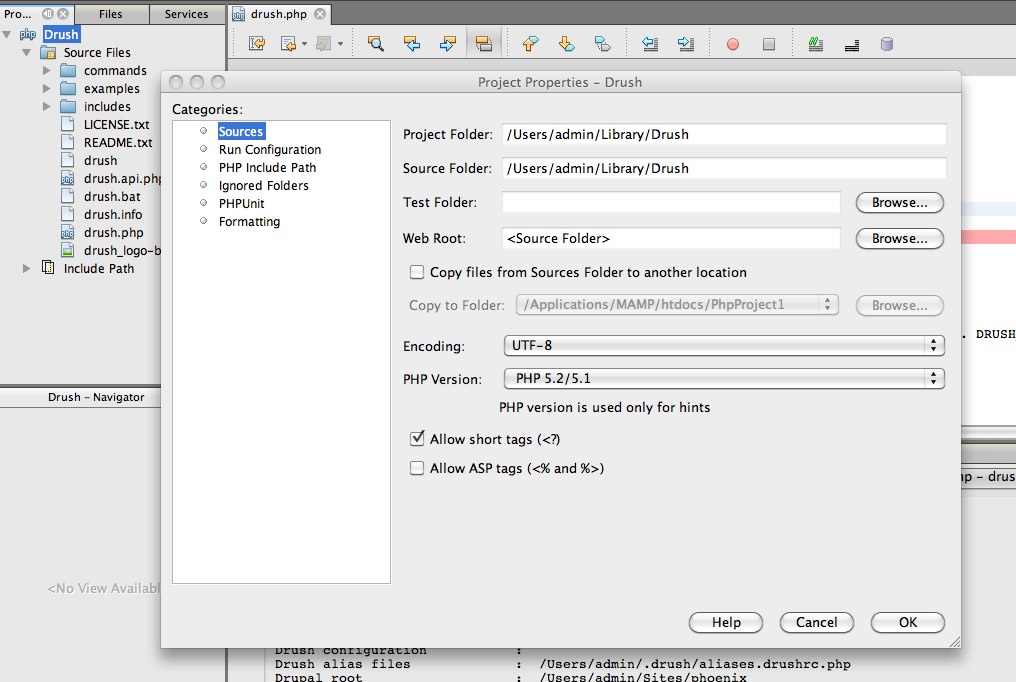
Fig. 3 - Project properties: run configuration.
Conclusion
You then debug by hitting the debug button, it should be on the toolbar or go to Debug -> Debug Project. Remember to put in a break point or have "Stop at first line" checked in the Netbeans Preferences.
I wasn't able to get this working so that I could just run a command from the CLI and it would be captured in the IDE. When you create a normal web project in Netbeans it has an option "Do not open in Web Browser". I wasn't able to get CLI debugging working this way although it seems that Moshe has been able to do this...
Comment #5
simeBetter title and category
Comment #6
adf1969 commentedI just configured my Mac OSX 10.7 (Lion) to perform CLI debugging with drush by doing the following:
My setup is:
MAMP Pro 2.0.5
Eclipse 3.7.1
PHP 5.3.6
XDebug 2.1 (this version now ships with MAMP)
Although since I am using Eclipse, I have set mine to:
XDEBUG_CONFIG="idekey=ECLIPSE_DBGP"
Go to File | New Project
Select PHP Project
Type in a project name
Select "Create project at existing location (from existing source)
Browse to find the ROOT of your Drupal installation (mine is at /Applications/MAMP/htdocs/gst)
For "Project Layout" I chose "Use project as source folder" (although I'm thinking you could choose "Create Separate folders.." and that might also work, but is not what I did).
Click "Next" and it will create a project with the name you typed.
This is the part I had a problem with at first.
Open up your Project Properties (select Project | Properties)
Select "PHP Build Path"
Click "Link Source"
Click the "Browse..." button and browse to where your drupal.php file is (mine is at: /usr/local/pear/share/pear/drush)
This will create a "conflict" (since it is essentially creating an Eclipse "link" in your Project Source (not a Unix Link).
To fix the "conflict" click "Update exclusion filters in other source folders to solve nesting."
That will *remove* the "drush" folder from source, and then re-add it - this is what you need so you can navigate to the source and set breakpoints etc.
You should now be able to open up a Terminal window and run drush commands and if you set any "breakpoints" in your drush code (such as in DRUPAL_ROOT/drushrc.php or in DRUSH_ROOT/drush.php) Eclipse will "break" on those lines.
Hopefully this helps anyone else out that spent hours trying to get this to work!
Comment #7
rdatar commentedThank you for your detailed settings and screenshot.
Couple of things that were different for my setup and that made the difference were :
1. Run Configuration > PHP Interpreter >
I used /usr/bin/drush instead of PHP as the interpreter and I unchecked the Use Default PHP Interpreter box
2. Run Configuration > Default Working Directory >
The actual site location ( not drush location )
3. Run Configuration > PHP Options >
Parameters I wanted to pass to the drush command
Hope this helps someone.
Cheers!
Comment #8
texas-bronius commentedHi -
I have a hunch the arguments line in #4 screenshot above could be made dynamic by being made something like:
-r ${folder_prompt:Site} ${string_prompt:Command and arguments}copied in literally as presented, but I don't recall where I found it, and it's not working for me anyway :) I am adding it to the thread in case someone can figure it out.
-Bronius