
This project is not covered by Drupal’s security advisory policy.
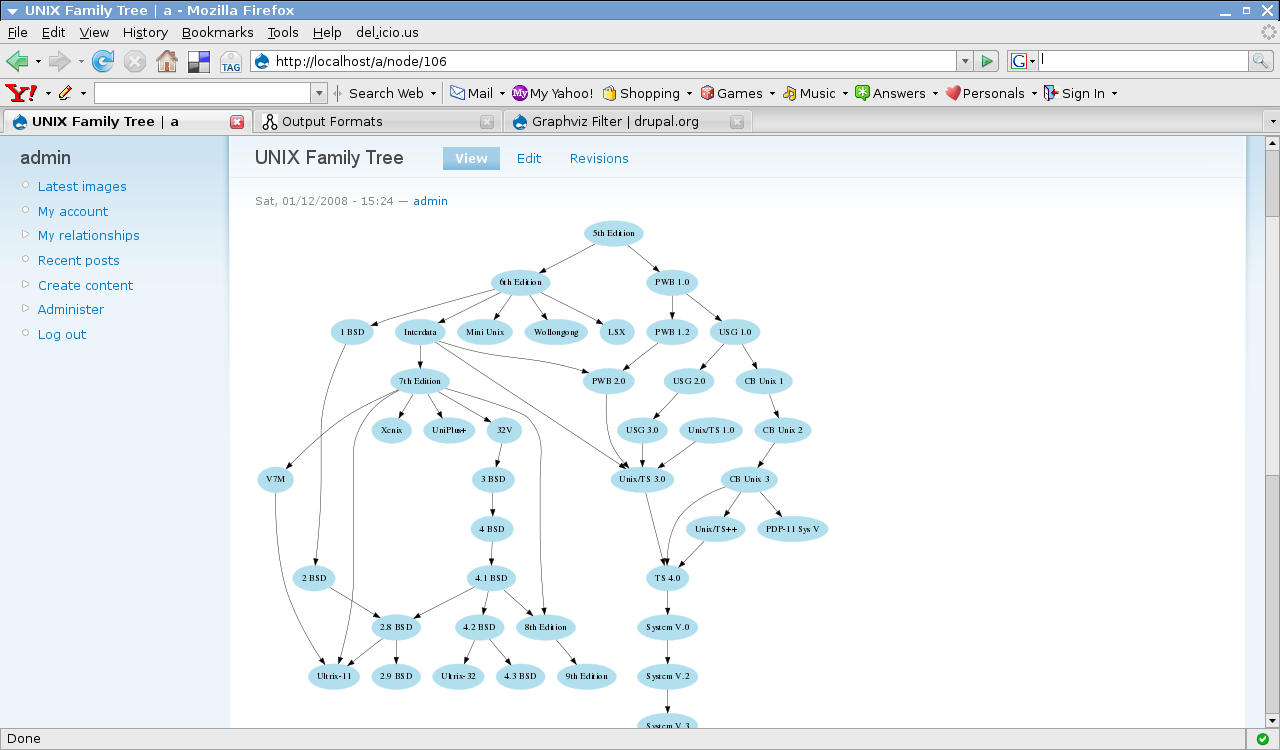
Graphviz Filter is a fun little filter that treats input text as Graphviz DOT syntax, converts it using Graphviz tools to the requested format(s) and renders it in HTML. It's useful to quickly create graphs dynamically from within Drupal nodes. A particularly exciting application is to create an input format consisting of PHP code followed by Graphviz Filter, thereby allowing one to write code that outputs a DOT file, which is then rendered to HTML. For example, one could create a visual taxonomy tree with nodes hanging from the terms, and each visual node would be clickable (using the URL Graphviz attribute) to point to the actual Drupal node. Stuff like that!
Thanks to varienne for the great documentation (in the Resources section below)!
REQUIREMENTS & INSTALLATION
Graphviz package
- Ubuntu/Debian:
sudo apt-get install graphviz - Windows: Download the latest version.
- Mac OS X + MAMP: Download the latest version.
Set Apache to find the newly-installed commands by appending to the file/Applications/MAMP/Library/bin/envvars:export PATH="$PATH:/usr/local/bin"then restart Apache.
- Ensure that the Graphviz tools are on the system PATH by opening a console and typing:
dot -VIf the command is not found, you will need to troubleshoot as described in the documentation below.
PEAR::Image_GraphViz
Not required for the core filter module, but required for the application sub-modules. Install this package by typing:
pear install Image_GraphViz
provided `pear` is on the system PATH. In Linux, you might need to prepend `sudo`.
If you don't have control over your host, here's how to manually install Image_GraphViz:
- Download the latest package directly.
- Expand the package to the graphviz_filter module folder for example.
- Rename the expanded folder to
Image. - Configure your Graphviz input format (found in
admin/settings/filters/list) such that the path of PEAR::Image_GraphViz package is set to the full path of the graphviz_filter module. - Ensure that your settings are correct by checking the Drupal status report at
admin/reports/status, entry named "Graphviz PEAR package".
USAGE
Enable the module, then add the Graphviz Filter to whatever input format you like. Enclose the DOT syntax within [graphviz]...[/graphviz] tags. In order to control the output, use the following arguments in the DOT comments:
- @command: Process the graph script using this Graphviz command (`dot`, `neato`, `twopi`, etc).
- @formats: Comma-separated list of desired output formats. Formats are listed in the filter info and tips.
- @title: Title of the output image.
In addition, each renderer can define its own arguments that are listed in the filter tips.
EXAMPLE
Put this in the body of a node whose input format is PHP code followed by Graphviz Filter:
<?php global $user ?>
[graphviz]
/*
 * @formats = svg, png, gif
 * @imagemap = true
 *
 */
digraph G {
        fontname = "Bitstream Vera Sans"
        fontsize = 8

        node [
                fontname = "Bitstream Vera Sans"
                fontsize = 8
                shape = "record"
        ]

        edge [
                fontname = "Bitstream Vera Sans"
                fontsize = 8
        ]

        User [
                label = "{<?php echo $user->name ?>|+ name : string\l+ age : int\l|+ hello() : void\l}"
                URL = "http://www.drupal.org"
        ]
}
[/graphviz]
FREQUENTLY ASKED QUESTIONS
Q. How can I render a graph for [buddies, taxonomies, etc.] using this module?
To generate graphs programmatically, you can use graphviz_filter_process($dot) which accepts DOT syntax or graphviz_filter_render($G) which accepts a PEAR::Image_GraphViz object.
Q. How can I render Wiki format in the same node as a Graphviz diagram?
Use the following recipe:
- Use the PEAR Wiki Filter module.
- Create an input format made up of filters "PEAR Wiki Filter" followed by "Graphviz (DOT) syntax".
- Configure the PEAR Wiki Filter section of the new input format such that the "Ignore regexp" field is set to
/\[graphviz\](.*?)\[\/graphviz\]/si - If you want to include many filters with the PEAR Wiki Filter (such as GeSHi + Graphviz), set the "Ignore regexp" field to
/(\[graphviz\](.*?)\[\/graphviz\])|(\[geshifilter-code\](.*?)\[\/geshifilter-code\])/si
You can now type Wiki syntax in which you embed any number of [graphviz]..[/graphviz] blocks.
APPLICATIONS
The following applications are included in the package as separate modules:
CCK Schema
Used to render a diagram of CCK types and relationships.
Workflow Graph
Used to render diagrams of workflow definitions and histories.
Taxonomy Graph
Used to render diagrams of taxonomy term hierarchies.
Graphviz Noderef
Used to render a diagram of nodes and their relationships.
TECHNICAL DETAILS
- Stores generated output in files/graphviz. Ensures uniqueness of filenames by naming them with md5 of input script.
- Uses two new hooks to allow new ways to render the graph:
hook_graphviz_formats()returns an array of Graphviz rendering formats that the module supports.
<?php
function mymodule_graphviz_formats() {
  return array(
    'myformat_1' => array(
      'description' => t('Format description'),
      'format' => 'png',
      'arguments' => array(
        'argument_1' => array('description' => t('Argument description'), 'value' => 'default value'),
      ),
    );
  );
}
?>
where the
formatentry refers to one of the supported DOT output formats. The filter will render the graph to this format and then hand the generated file to your module for embedding in HTML.hook_graphviz_render($inpath, $outpath, $format, $args)actually renders the graph to an HTML fragment that is displayed as output of the filter.$inpathis input DOT file,$outpathis generated file,$formatis the format being rendered (e.g.'myformat_1'above), and$argsis the array of arguments found in the DOT script.
- To generate graphs programmatically, you can use
graphviz_filter_process($dot)which accepts DOT syntax orgraphviz_filter_render($G)which accepts a PEAR::Image_GraphViz object.
Happy visualization!
Project information
 Seeking co-maintainer(s)
Maintainers are looking for help reviewing issues.- Maintenance fixes only
Considered feature-complete by its maintainers. - Module categories: Content Editing Experience, Integrations
 29 sites report using this module
- Created by infojunkie on , updated
 This project is not covered by the security advisory policy.
Use at your own risk! It may have publicly disclosed vulnerabilities.
Releases
7.x-1.0-alpha1
released 20 July 2012
Works with Drupal: 7.x
✓ Recommended by the project’s maintainer.
Development version: 7.x-1.x-dev updated 13 Sep 2019 at 15:03 UTC


