
/admin/reports/analytics is just a collection of images. The descriptive text is part of the image and there aren't even alt tags
| Comment | File | Size | Author |
|---|---|---|---|
| #7 | screenshot_004.png | 53.31 KB | mstef |
| #6 | drupal_commons-update-quant-revision-1342658.patch | 489 bytes | mstef |


Comments
Comment #1
mstef CreditAttribution: mstef commentedThe images are generated via Google Charts API. To the best of my knowledge, and since I'm the maintainer of Quant, the module producing these charts, I don't think you can specify ALT tags for the images. Do you think it would be useful if there was an admin option to not use charts, but switch to text-based stats?
Comment #2
ezra-g CreditAttribution: ezra-g commentedIIRC, Google chart images are generated entirely by query string. What prevents Quant from either adding an alt tag to the image or (less ideal) including additional markup that describes the chart data?
Comment #3
mstef CreditAttribution: mstef commentedchart_render() is used to generate the chart via Google. The entire HTML is returned. I'm not sure how you'd inject an ALT tag. If you're visually impaired and cannot read the chart, I don't know how an ALT tag would be useful, other than saying that the chart is. I'd need to review Chart and Google Charts API to see if ALT tags are an option.
Comment #4
ezra-g CreditAttribution: ezra-g commentedLooking at chart_render(), looks like we can pass an $attributes array - couldn't we put an alt in there with some amount of data there? http://drupalcode.org/project/chart.git/blob/refs/heads/6.x-1.x:/chart.m...
Or, if this doesn't translate well to text in an alt tag, present an HTML table?
Comment #5
mstef CreditAttribution: mstef commentedI was thinking HTML table with some numeric data. The quant objects are loaded with all of the data, aside from the charts. I suggested creating an admin setting that used text instead of images, then just plotting out some simple tables. Would take some work, but totally doable.
What do you think?
Comment #6
mstef CreditAttribution: mstef commentedAdded the requested functionality to quant: http://drupal.org/commitlog/commit/15326/8598eeed261b657d2239421d7d3a565...
An option to output as tables is now present on the quant admin settings page.
Patch attached to alter make file to use the newer commit of quant in Commons.
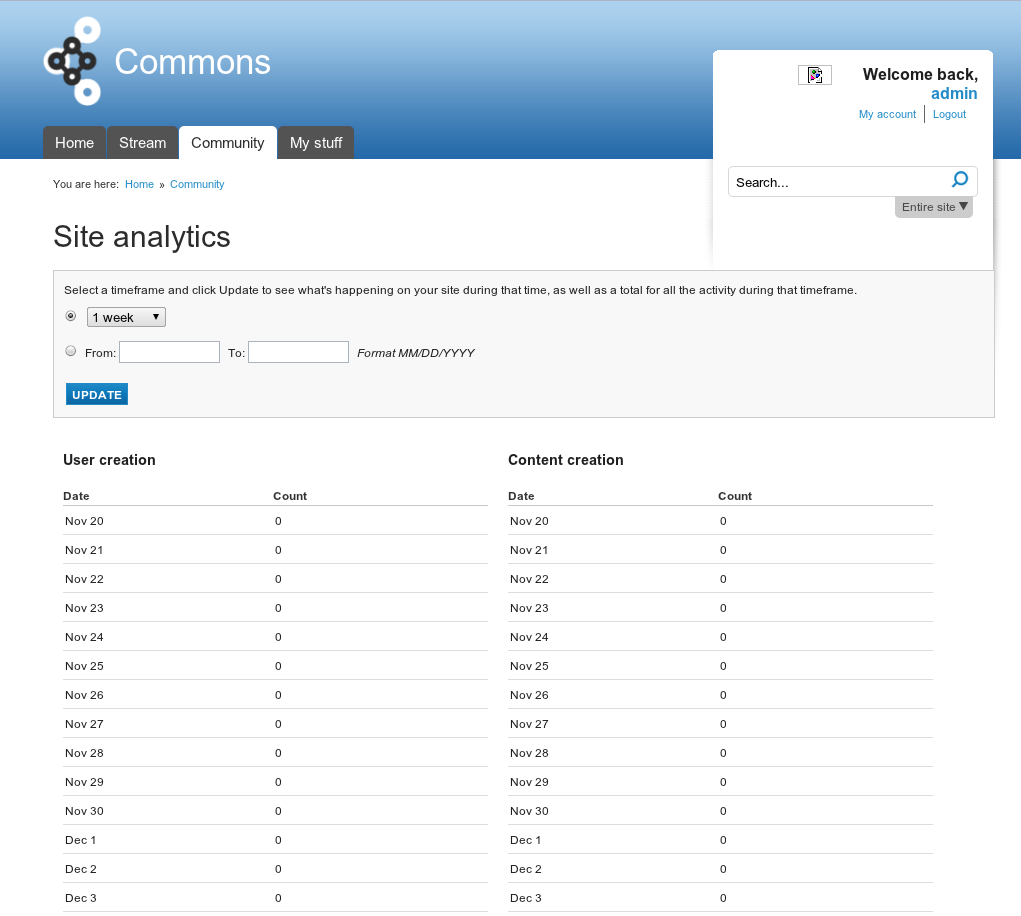
Comment #7
mstef CreditAttribution: mstef commentedScreenshot preview of tables:
Comment #8
Devin Carlson CreditAttribution: Devin Carlson commented