 Support for Drupal 7 is ending on 5 January 2025—it’s time to migrate to Drupal 10! Learn about the many benefits of Drupal 10 and find migration tools in our resource center.
Basic concept
The OpenLayers module enables the display of any content with geo data (node, user, taxonomy terms) as layers on top of base maps (base layers) in layer maps. It provides a user interface to configure the styles of this content (color of dots, thickness of lines, highlighting, ...), and the behavior of the maps (zooming, tool tips, ...).
Layers, maps, styles and behaviors are stored as objects.
The configurations can be exported to code or included as a part of a feature with the Features module.
Changes from OpenLayers 2.x for D7
- The 'Preset' were changed to maps (admin/structure/openlayers/maps).
- The OpenLayers module focuses on displaying data and therefore does not provide its own input field anymore. You can use the Geofield module for inputting geo data.
Required modules
These need to be enabled before moving to the next step.
- OpenLayers: OpenLayers, Openlayers UI, OpenLayers Views
- CTools
- Views 3: Views, Views UI
- Libraries: Use the 2.x version, and make sure to create your sites/all/libraries subdirectory.
- geoPHP (dependency for Geofield 1.1 and higher)
- Geofield (use 1.1 or higher) or other module for inputting geo data.
Drush makefile
If you have Drush 5 installed you can use this drush makefile to download Drupal 7 core, all required modules and the Openlayers 2.11 library for this tutorial much more quickly to an empty website document root (rename the download file to openlayers.make). You need to install Drupal via your browser and enable all required modules in a second and third step (look into the makefile for a drush command to enable all required modules quickly).
Overview of the main steps
The following four steps switch between Views and OpenLayers module and back. The order of these steps is important and cannot be changed.
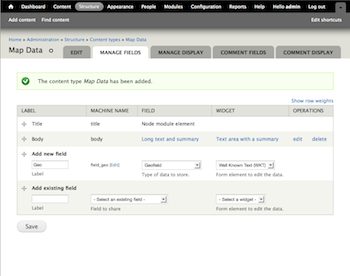
- Add geodata nodes
- Make a data overlay layer in Views.
- Configure a map
- Add data display to the map through Views.
Step-by-step instructions
This example is a step-by-step manual for displaying the locations of several nodes on a map in Drupal 7. Check this manual for Drupal 6.
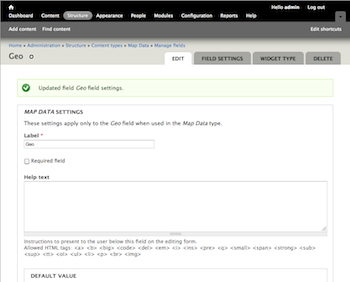
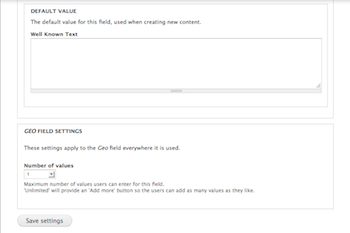
1. Add Geofield data to node
The first step is to create a mechanism for storing geo-related data. Geo data can come in different formats (e.g longitude and latitude, well-known text WKT) or can be entered directly as points on a map.
In order to create maps with the OpenLayers module, it does not matter in which format the data is entered.
In this example we use Geofield to store longitude and latitude.
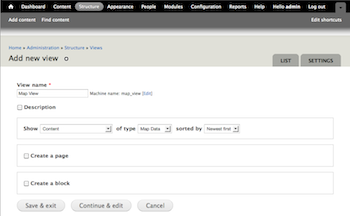
2. Make a data overlay layer in Views
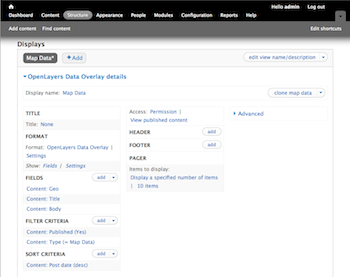
The OpenLayers module adds a plugin to Views to create OpenLayers Data overlays. This view display will not actually be visible, but serves to pull the required data from the nodes. It also allows you to add filters, arguments and relationships to the data you want to display on the final map, as well as the number of locations to be displayed. Check the Views handbook for additional information.
- Add a new View to show Content
- Add or edit the filter criteria (e.g. published content, content types)
- Add fields:
- The Content Geofield containing the geo data. Set the formatter to use
Well Known Text (WKT) - Optionally choose a title and a description field.
- NOTE1: make sure you uncheck "Use field template" in style settings (or markers might not show up)
- NOTE2: if your geodata is a polygon under the location field settings use a centroid instead of full geometry (otherwise a marker won't show on the map)
- NOTE 3: if you see a projection select list, you probably want this to be "ESPG:4326".
- The Content Geofield containing the geo data. Set the formatter to use
- Add an OpenLayers Data Overlay display, and give it a meaningful display name to identify it during the further steps.
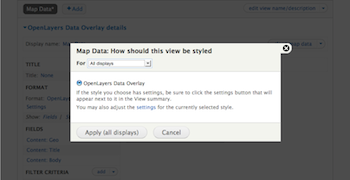
- Change the format this display (override) to "Openlayers Map" and use "OpenLayers Vector Data Overlay" (older versions might say "OpenLayers Data Overlay.")
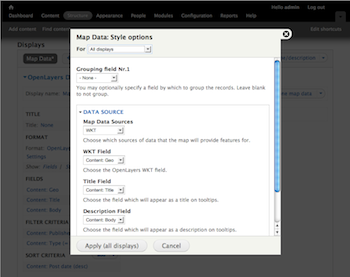
- In the Style options / Settings
- set Map Data Source: WKT;
- choose your geofield content as WKT Field;
- optionally choose your Title and Description.
- don't use "style field" as its dropped after 2.x beta9, as per this discussion
- Note: It's worth adding a page or block View at this time to allow you to see the raw HTML, but not necessary.
- Save the view.
3. Configure a map
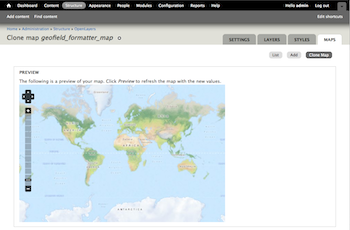
A Map is a collection of settings, base layers, behaviors and styles that define an OpenLayers map. In Drupal 6 this was called a 'Preset'.
- Go to Structures » OpenLayers » Maps, and either add a new map or clone an existing one.
- Configure your map:
- Basics (also called Infos) allows you to change title, description, width and height of the map as well as a few other map specific settings.
- Center & Bounds allows you to determine where the map will start from: on which point it will center and at which zoom level it will display initially
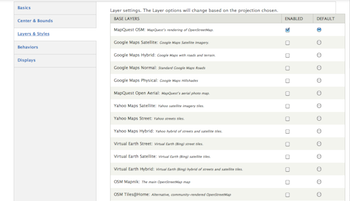
- In Layers & Styles you have to:
- Choose a base layer that will act as background of your map. If you choose several base layers then users will be able to swap between them.
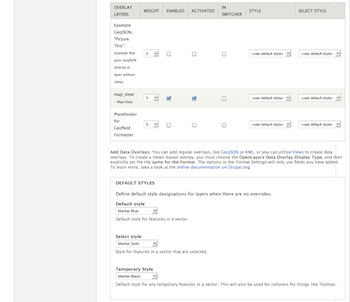
- Enable the Data Overlay that you have created in the previous step. You can also enable several Data Overlays here, arrange their weight, decide whether they should be activated or not, and whether they should be displayed in different styles.
- Set the default style for markers and other features.
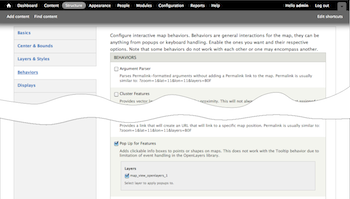
- Behaviors are events and functions that can be added to the map, e.g tool tips, a bar to zoom the map etc. Some of these options fulfill similar functions, so they might not work well together.
In this example we enable the Data Overlay we have created, and set a blue marker, a gold selected marker and a black temporary marker as the default styles.
In this example, locations have a title and a description so either enable
Pop up for FeaturesorTooltip for Features. - Save your map.
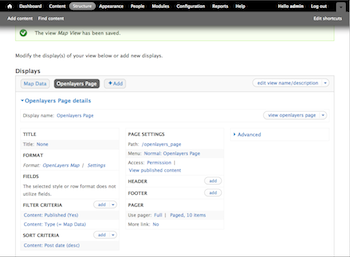
4. Display the map through Views.
Go back to the View you created in step 2, and now add another display that will actually display the data on your map. (This display could also be added in a different View, but keeping both displays together has the advantage of ensuring that they both have the same fields, filters, arguments etc.)
If you have changed the number of items to display, or used arguments and relationships in the OpenLayers Data Overlay then these need to be present in this display as well.
- Add a display in which your map will be displayed. In most cases this will be a page or block.
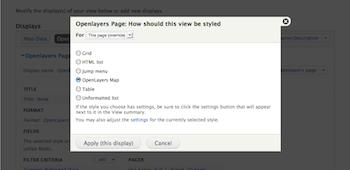
For this example add a page display - Set the format of this display to OpenLayers Map
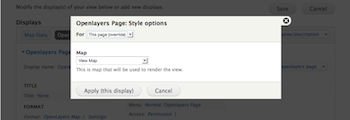
IMPORTANT: override the format of this display - you must be careful to only do this for the new display, and not clobber your settings in the previously saved displays. Do this by changing away from "For All Displays" - Set the Style options / Settings for this display by choosing the map you created in the previous step
- Set a path for your new page. If you created a block or content pane you need to add them to a region later.
- Save your view
5. Add Map Data nodes
Here is a sample value of WKT for your initial testing. (You can use your own Longitude and Latitude)
POINT (-123.39 48.89)
You should now be able to see your map with data points on it.
Links to Other Docs and tutorials
- Basic setup of Drupal 7 + OpenLayers + Geofield + Views 3. Apr 2012. http://www.syntux.nl/blog/basic-setup-drupal-7-openlayers-geofield-views...
- Addressfield with Geofields in Openlayers. March 2012. http://drupalovereasy.com/drupal-7/tutorials/addressfield-geofields-open...
- Placing Users on a Map in Drupal 7 - with Openlayers, Addressfield and Geocoding. May 2011. http://www.istos.it/en/blog/mapping/openlayers-and-addressfieldis
- Intro to Open Layer in Drupal 7. Feb 2012. (video) http://www.youtube.com/watch?v=lk8kTHm6nmc


Comments
Thanks
Thanks very much indeed for this very comprehensive documentation. It has been extremely helpful.
GlossyIbis
Great post. Thank you very
Great post. Thank you very much for such an insightful documentation. God bless you.
Comprehensive Document
Very Comprehensive Document, greta work.
http://rootinfosol.co.uk
Great instructions!
The instructions are great and correct.... but what a palaver to get a View presented as an OpenLayers map! Even with these wonderful instructions, I still managed to stuff it up a few times, because it is just so fiddly!
Also appears that only views with Geofields are supported and within Geofield only the WKT widget? Is that right?
So if I have a View based on the Location module or the Geolocation Field module (or in fact Geofield) is IP Geolocation a better alternative?
link between a dot on the map and a node
so I created a CT localisation what give me the WTK about a dot and his name like: Dakar(2.78902345 -1.2222222) for example and I added many content like Dakar...(New York ,Paris,Sydney)
Now from my map I want to access direct the node Dakar if I click on a Dakar's dot !
I need help if someone knows how to do that!
thanks.......
Clicks on map to get access to node
Just play around Behaviors section of configuration of your map.
It's in admin/structure/openlayers/maps//edit
and check some checkboxes: ex. Tooltip or Pop-up dialog
proximity search with
proximity search with Openlayer & co modules ....
As I am trying to get a project going that allows you to search for advice, help, projects near you (prox. search) I have been up and down the www, made my own list of tutorials and started to write my own - unfinished one "Openlayer Proximity Search".
Any hints and help would be very much appreciated - all will be added to my tutorial and be published.
I got going with various tutorials and managed to get quite a way - but in the end I can't get the map to zoom in on the locations in x km/miles from the starting point (let's say London, etc.) like http://www.opengreenmap.org/greenmap and others.
And before I go - thanks - this is a good tutorial and someone spent some serious time and thought on this - thanks.
...............
PHP Memory limit
Hi,
This is a great post, thanks!
I followed the above instructions to the letter on my shared host.
Unfortunately I ran into the "Fatal error: Allowed memory size exhausted... etc."
Just in case anyone else runs into this problem, check out the following post I found when trying to resolve my issue: http://drupal.org/node/1276174 (#6)
Basically, when you come to step 4 above, make the View display on a new View rather than adding it to the existing View created in step 2. It worked for me.
Hope this helps someone.
Edit your php.ini
On a map representing more than 1000 nodes, I had to increase the memory limit in php.ini to 784M.
memory_limit = 784M
So play with this. The default config of this value is usualy badly low.
--
Julien MARY
Pop Out
Thank you very much, so far everything worked fine!
But i don't get that with the popout boxes. I'd like to show some feature-related information (the attributes of my polygon) by clicking on the polygon. If i activate the according boxes in the behavior-section (Pop Out for Features odr Pop Up for Features), i can only mark a polygon, but no popup or popout appears. Are there any additional settings to do in the views-section to enable popouts?
How to detect location on the map through textual address
Hey, is it possible to detect location through text, as we do with google maps, simply write down the location textually, and it will take you to that location.......! actually I am developing a site, on with, end user is asked to give the location on the map.........! i want user to simply type the location, no longitude latitude stuff, simply text, e.g, if the user types Islamabad, map should respond to the location entered.......! Thanks in advance.......!
.
... you need to look into WKT - Well Known Text in connection with Geofield.
I wrote a page on proximity searches - Openlayers Proximity Search – Drupal 7 - where I used this - the project is still not online - still on the workbench ...
Thank You
What a huge help! Thank you for these very comprehensive and accurate instructions!
This is a great tutorial, but
This is a great tutorial, but I think you should add one small detail to step no. 2 that has given me a lot of headaches before I figured out the problem.
if your geodata is a polygon, a marker won't show on the map unless you define, in your view, under the location field settings, to use a centroid instead of full geometry.
Ok, I just figured out that I
Ok, I just figured out that I can do that myself :-).
Thank you!
I followed numerous tutorials and couldn't get any points to show up until I found your comment about the Centroid! Thanks so much!
Driving me crazy
Hi - I have gone through this tutorial (and others) several times, but am still unable to get this to work. What am I missing?
Arggh. Just realised I am an idiot. In section 2, part 5: Change the format of this display to "OpenLayers Data Overlay."
there are now two options:
You need to choose the second option. The old 'if in doubt, go with the default' rule doesn't apply.
Don Robertson
Christchurch, New Zealand
don@robertson.net.nz
021 294 1542
OpenLayers settings
Hi, thanks so much for this tutorial! Is there a way to add steps as to how to test the page? Do I have to create a content for it? I have no idea what it means to add a map data node. Thank you!
Use Full Geometry is fine
I followed these instructions to use a Centroid, but it doesn't seem necessary. Use Full Geometry seems to work fine (as does use a Boundary Box).
Update needed
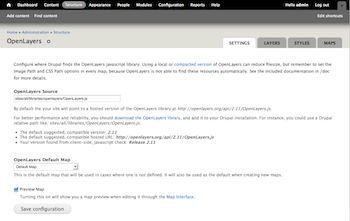
This page needs to be updated, actually "admin/structure/openlayers" has changed a lot and screenshots do not match anymore.
(eg "Source" tab has been introduced)