
Problem/Motivation
See #2368797: Optimize ajaxPageState to keep Drupal 8 sites fast on high-latency networks, prevent CSS/JS aggregation from taking down sites and use HTTP GET for AJAX requests, #49.5 and #50.5.
Also, see #11:
I have multiple #lazy_builder-powered elements on the page which use
#attachedproperty. It results in the numerous libraries dependencies re-calculation.
Steps to reproduce:
- Install fresh 9x-dev Drupal;
- Enable forum module;
- Created some test node and add 50+ comments;
- Open a page as an admin who has both edit and delete links (so they are lazy-built);
- Run the profiler before and after applying the patch;
To summarize: dependency calculation is expensive in some cases. Let's make it better.
Proposed resolution
- Replace
in_arraywith cheaperisset; - Add static cache to the
getLibrariesWithDependenciesmethod;
Here we can see the results after applying the proposed changes:
| Before (Blackfire profile) | After (Blackfire profile) |
 |
 |
The win is at least4% of the page generation time, but it can be more for complex websites setups with more libraries 😋
Remaining tasks
Investigate- Review
- Commit
User interface changes
None.
API changes
None.
| Comment | File | Size | Author |
|---|---|---|---|
| #39 | blackfire_diff.png | 54.35 KB | Berdir |
Issue fork drupal-2407187
 Show commands
Start within a Git clone of the project using the version control instructions.
Or, if you do not have SSH keys set up on git.drupalcode.org:


Comments
Comment #1
Wim LeersThe parent issue landed, we can work on this now.
Comment #2
Wim LeersComment #11
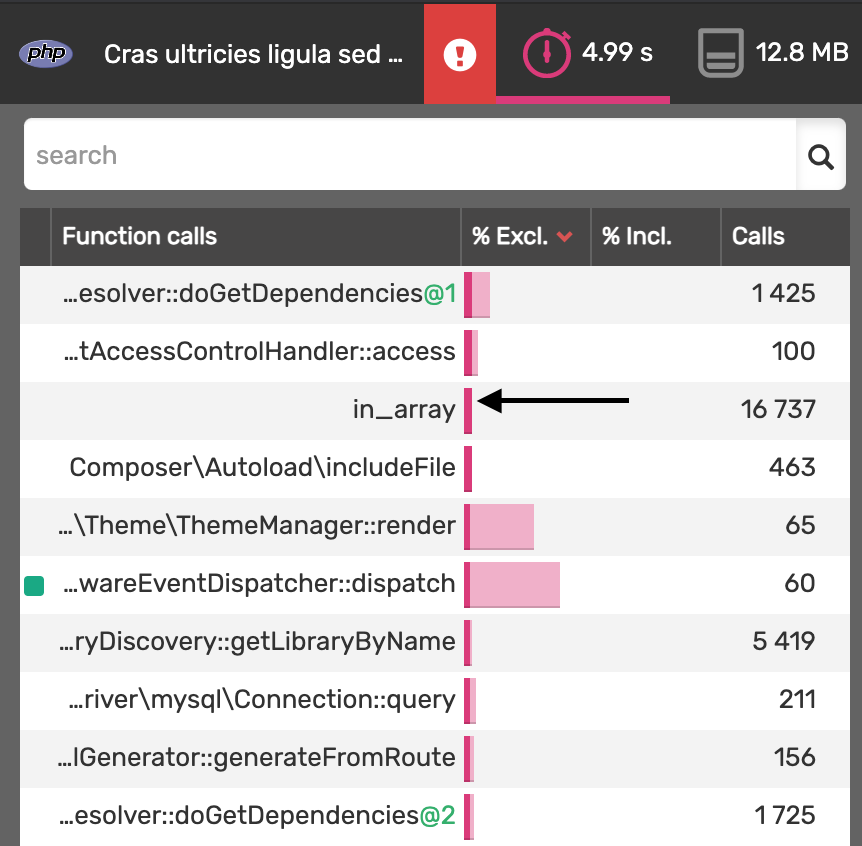
artem_sylchukHi guys, during the investigation of the possible performance optimizations in my current project I found that the most called and time-consuming function is the "in_array" call coming from LibraryDependencyResolver. I have a multiple #lazy_builder-powered elements on the page which use #attached property. It results in the numerous libraries dependencies re-calculation. I've replaced in_array with cheaper isset calls, plus added static cache to the getLibrariesWithDependencies method.
In my case it allowed to cut down the page generation time from 5.3s to 3.66s according to the blackfire.
Comment #12
abrammHi @james_kerrigan,
I've looked through the patch quickly and noticed you're using a static variable inside getLibrariesWithDependencies().
It'd be better to replace it with an object property.
Comment #13
artem_sylchukThanks @abramm, here is the updated version.
Comment #14
artem_sylchukSeems it breaks the aggregation.
Comment #16
artem_sylchukI investigated the reasons why my changes were breaking the aggregation and found that it was because of the changed order of libraries in getLibrariesWithDependencies. Fixed in a new patch and works perfectly for me.
Comment #19
artem_sylchukAs a part of #ContributionWeekend2021 I decided to finish with this issue.
I checked failing tests and they expected numeric keys in arrays.
But in order to get rid of heavy array_search calls I made keys identical to the values: they both hold the library name now.
It allowed to use much cheaper isset call. So I updated tests to check for the library name as a key.
For the test I installed fresh 9x-dev drupal core, enabled the forum module, created some test node and added 50 comments.
I opened page as an admin who sees the edit and delete links (that are lazy-built).
Here are results before the patch: https://blackfire.io/profiles/bba7cc60-1c7d-4cad-9941-81247a410a2f/graph
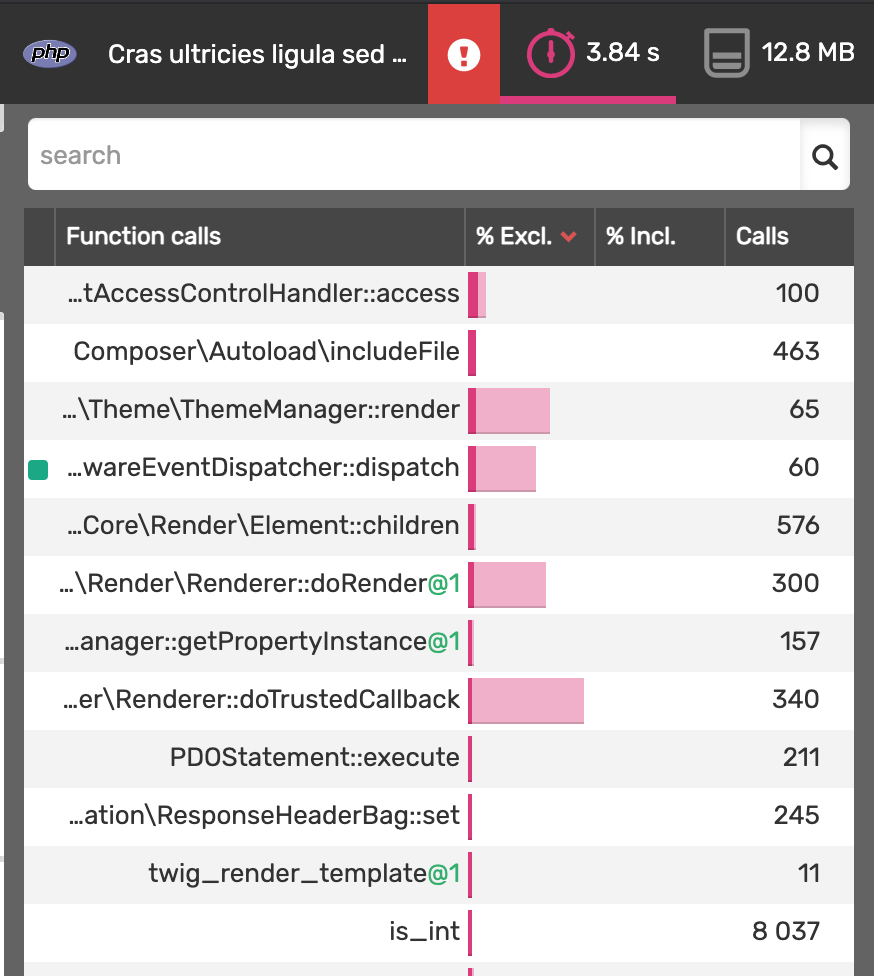
And after: https://blackfire.io/profiles/f72f7d6d-fcee-4074-b02f-9c06787f3cea/graph
Win is around 10% of the page generation time.
Before:

After:

Comment #22
MatroskeenThe reports look good to me and the numbers are really impressive!
Although I'm not familiar enough with the asset library system to review the code, I'd like to make it easier for other reviewers.
Therefore, I opened a merge request based on the latest patch and compiled issues comments into an updated issue summary.
Comment #23
artem_sylchukComment #24
Wim LeersYAY! Somebody started working on this optimization half a decade after I proposed it! 🥳😄
Thank you for your awesome work and especially your very convincing profiling screenshots 🤩
AFAICT the changes here are merely reformatting the code.
Is that right?
Because right now it seems as if you're modifying the test coverage.
Making this change without modifying the test coverage is much less risky.
Can you please revert these changes? 😊🙏
Comment #25
Wim LeersBumping to based on the 23% and >1 second difference you are observing. I suspect it's a pretty extreme case, but in that case it definitely is hugely important. And it won't hurt any other Drupal site either obviously 😄
Comment #26
artem_sylchukHi, that's not only code re-format, the tests were updated too, unfortunately :(
In order to get rid of the in_array call I had to replace numeric keys with the library name.
As far as I remember I couldn't do just some array_flip and leave keys untouched.
I'll try again to check if it is possible to do the same without touching the tests.
Comment #29
longwaveI opened an alternate merge request that keeps the return values from getLibrariesWithDependencies() the same numeric array as before, and that means the tests don't have to change.
Comment #30
artem_sylchukHey @longwave, looks like you've done what I was going to do, thanks! Looks much better now
Comment #32
MatroskeenAwesome!
It means we can close merge request !327 in favor of merge request !342
And now we're looking for another review 😇
Comment #33
BerdirI've definitely noticed library/css processing showing up in profiling as well. Just a note, be careful to manage expectations here. Many calls to small, fast functions tend to be *massively* overreported (easily 5x or more, especially if xdebug is also enabled as the warning icon in the screenshots in the issue summary indicate) in blackfire and similar tools. To have realistic numbers on how this improves things, try to have xdebug and blackfire extensions disabled and test with a simple benchmarking tool like ab.
Will try to do a review.
Comment #34
andypostAdditionally to #33 I suggest to check https://github.com/tideways/php-xhprof-extension which adopted new Observer API for php8 so it should not bring such viable overhead
Comment #35
jchristi CreditAttribution: jchristi at Red Hat commentedPerhaps also have a look at eBPF-based profiling: https://github.com/iovisor/bcc
Comment #36
andypostThere's also https://github.com/LionsAd/xhprof-kit
Comment #37
Wim Leers🥳
Comment #38
BerdirTested this quickly
* Made sure xdebug and blackfire extensions are disabled.
* Created an article
* Generated 50 commits for it
* Running 50 ab requests with my uid 1 session cookie:
ab -H 'Cookie: SESS....=....' -n 50 http://d8/node/1JS/CSS aggregation enabled, render/page caches disabled:
Without the patch: 3 tries, 125-128ms
With the patch: 3 tries, 122-123ms
JS/CSS aggregation enabled, render/page caches enabled, warm cache:
Without the patch: 3 tries, 55ms
With the patch: 3 tries, 51-53ms
So, clearly an improvement, but also less than what the issue title currently claims. That is with the latest patch/MR. It is possible that the other implementation was slightly more efficient, I don't know, didn't look at either MR.
I also compared with blackfire, there it is 150ms to 134ms (so xhprof is ~3 slower). That's 11%. If xdebug was enabled as I suspect from the initial screenshots then that might just blow it up to 20%+.
It is also possible that the gain would improve on more complex sites, with more libraries.
Comment #39
BerdirForgot the blackfire diff of the two runs.
Comment #40
artem_sylchukThank you for your review @Berdir
Seems I was too excited to see results in the balckfire that I didn't notice that I was running it with xdebug enabled.
So, looks like the real improvement is much smaller than I claimed initially.
Probably that should be reflected in the issue title.
In my case I had 200 comments on the page, each of them had additional element using #lazy_builder, so it resulted in 400+ bigpipe requests. Patch helped a lot for me, but anyway I ended up completely rewriting the comments links and used singe #lazy_builder that updates drupalSettings with links data used by custom script that places links on the page. Not sure if it is ok that it is so easy to get so many lazy-built elements on the page.
Comment #41
Wim LeersThanks, @Berdir!
Aha, that is indeed a pretty exceptional scenario, and probably explains the difference. Perhaps it's also a site with relatively many asset libraries? I think that @Berdir tested with
bartik(can you confirm, @Berdir?).What do you think about the change I made in this comment, @artem_sylchuk & @Berdir?
Comment #42
artem_sylchukSorry for the confusion,
The 23% from the screenshots difference was caused by running blackfire with xdebug enabled.
Those screenshots were taken on clean drupal installation with forum module + 50 comments on the page.
Here I've meant the project where I faced the issue for the first time and it forced me to look for any possible optimisation.
I don't have any profiler runs remained from that time, so hard to say how big the performance improvement was.
Comment #43
Wim LeersNo worries!
How about this simpler claim then? 😊
Comment #44
artem_sylchukSounds good for me, thanks! :)
Comment #45
artem_sylchukEven the performance win isn't so big probably this still can be marked as RTBC?
The patch should give better results on the web-sites with a lot of libraries and wide use of the lazy-built elements.
Comment #46
MatroskeenSo we have proof of performance win and a green merge request.
I can't see any remaining items, so I assume this is ready to go!
Comment #49
catchCode looks solid and the numbers are encouraging.
Committed/pushed to 9.2.x and cherry-picked to 9.1.x, thanks!