 Support for Drupal 7 is ending on 5 January 2025—it’s time to migrate to Drupal 10! Learn about the many benefits of Drupal 10 and find migration tools in our resource center.
This project is not covered by Drupal’s security advisory policy.
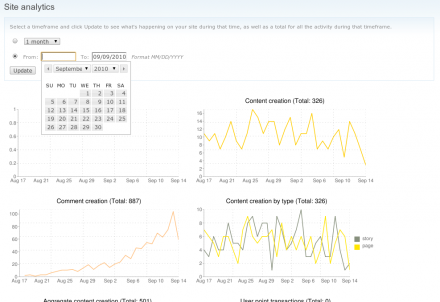
Quant provides an engine for producing quantitative, time-based analytics for virtually any Drupal component. Quant takes raw data about normal Drupal actions, such as node creation, and plots the activity over time, with the selected time being configurable. See the screenshot provided for a better understanding.
Requirements (Drupal 6)
-
Chart API
› If you're using chart-6.x-1.2, or lower, it is highly recommended that you apply this patch.
› If you're using chart-6.x-1.3, it is highly recommended that you apply this patch. - JQuery UI (only required to produce the datepicker widgets on the analytics form)
Recommended modules (Drupal 7)
-
Chart API
› Provide option to output charts as images using the Google Chart API.
Provided charts
- Content creation
- Comment creation
- Content creation by type
- Aggregate content creation
- User creation
- Page views (required Statistics)
- User shouts (requires Shoutbox)
- User point transactions (requires User Points)
- Group creation (requires Organic groups)
- Group joins (requires Organic groups)
- Invites sent (requires Invite)
- Invites accepted (requires Invite)
- Statuses shared (requires Facebook-style statuses)
- Private messages (requires Private message) -- only in 7.x dev branch (for now)
Provided chart plugins (Drupal 7)
- HTML tables
- Chart images (requires chart)
› Uses the Google Chart API
Quant API (easily provide your own charts)
The real power of Quant lies in it's ability to generate these charts with very little provided information. Quant offers a simple, yet flexible API to allow developers to include quant charts with their modules. If a maintainer of a module that you like isn't interested in providing Quant integration, submit a feature request ticket here.
API example
Provide a quant chart of comment creation over time
function my_module_quants() {
  $quants = array();

  $quant = new Quant;
  $quant->id = 'comment_creation';  // Unique ID
  $quant->label = t('Comment creation');  // The title of the chart
  $quant->labelsum = TRUE;  // Add the sum of items over time to the title
  $quant->table = 'comments';  // The database table
  $quant->field = 'timestamp';  // The column that stores the timestamp
  $quant->dataType = 'single';  // Only one datapoint used
  $quant->chartType = 'line';  // The type of chart
  $quants[$quant->id] = $quant;

  return $quants;
}
(See quant.api.php for more information - as Quant offers many more options for flexibility. The API varies slightly for 6.x and 7.x.)
Quant Chart API (chart plugins - Drupal 7)
- Implement hook_quant_charts() and the QuantChart class to render charts using your preferred chart library or module.
Project information
Seeking new maintainer
The current maintainers are looking for new people to take ownership.No further development
No longer developed by its maintainers.- Module categories: Media, Integrations
151 sites report using this module
- Created by mstef on , updated
This project is not covered by the security advisory policy.
Use at your own risk! It may have publicly disclosed vulnerabilities.
Releases
Development version: 7.x-1.x-dev updated 3 Jul 2012 at 00:55 UTC


