
This project is not covered by Drupal’s security advisory policy.
Building a Views Style that renders fields using GraphViz. Just the roughest beginning for now.
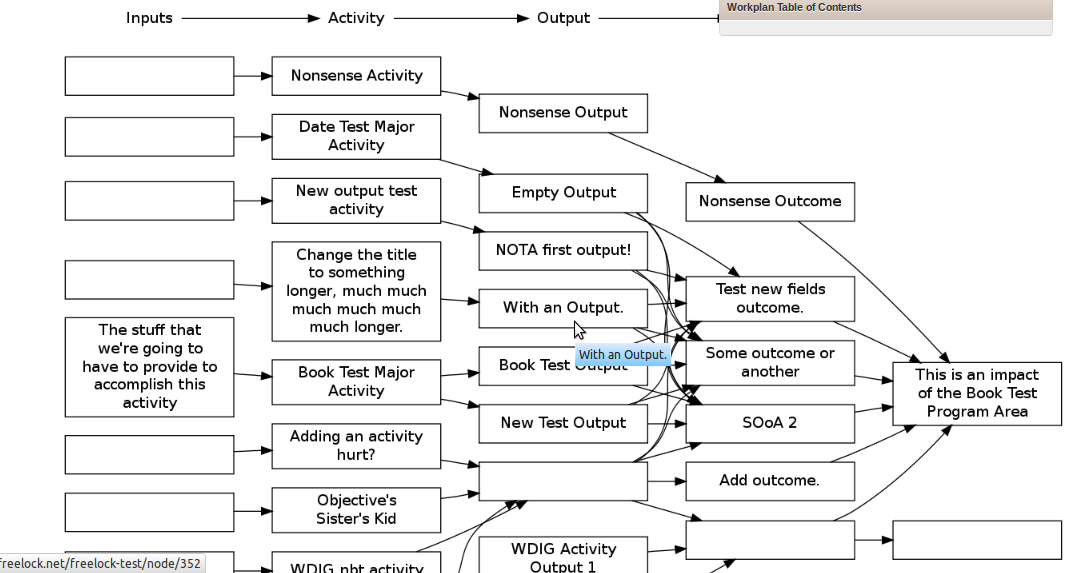
Initial style: uses "dot" to provide a flow-chart type of view. Each field will be rendered as a graphviz node, unless combined with another field. Fields can be combined in the graphviz style settings (using same pattern as the table style) to make subgraphs or records.
Each row will have its fields de-duplicated across rows.
Basically if you add fields from related nodes, you'll be able to see which nodes interact with other nodes.
If a field is linked, the link will be applied to the node.
Dependencies:
* Views
* Graphviz
* PEAR Image_Graphviz Library
Current status:
* Parses views fields and puts each visible field into a box.
* Each visible field in a row is linked to the next.
* Fields from the same node that appear in multiple rows get de-duplicated to only get drawn once.
* Fields are linked to their node.
The only configuration options currently picked up are field labels, and the "Exclude" flag on fields. More to come!
This project is sponsored by the International Training and Education Center for Health.
Project information
 Minimally maintained
Maintainers monitor issues, but fast responses are not guaranteed.- Module categories: Content Display
- Created by freelock on , updated
 This project is not covered by the security advisory policy.
Use at your own risk! It may have publicly disclosed vulnerabilities.


