 Support for Drupal 7 is ending on 5 January 2025—it’s time to migrate to Drupal 10! Learn about the many benefits of Drupal 10 and find migration tools in our resource center.
This project is not covered by Drupal’s security advisory policy.

Overview
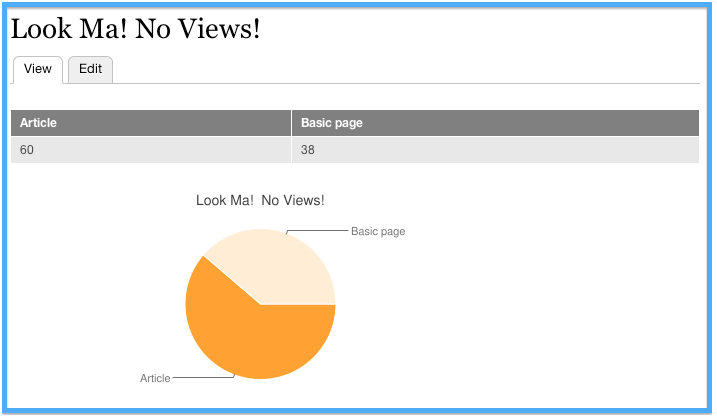
Report Builder helps narrow down and organize views results in a dynamic report. Report builder helps users to to create a table or chart with each data point sourced by an individual view. Each view has its own set of exposed filters which can be adjusted. This allows users to easily create graphs or tables that summarize drupal data, which they can reconfigure and play around with by changing the exposed filters.
Example Use Case
You're building a helpdesk ticket site for a client. The client wants to be able to generate reports of the ticket data and you don't want them mucking around in the views UI and messing up your delicate views. You generate a report builder view which totals all of the tickets. You add exposed filters for ticket priority, submitted date, and the 'assigned to' user. The client can then create any of the following reports as both tables and graphs:
-Total TIckets by Priority
-Total Tickets by Month
-# of Tickets Assigned to Each User.
Without the views UI!
Installation
Nothing special to do here. Install as you would any Drupal module. Report builder depends on:
Getting Started
Report builder includes a sample view with the Report Builder display type so you can see how a view could be set up. Generally the report builder views displays should have 1 field and 1 result with a set of exposed filters. Most likely "Use Aggregation" will be used to generate sums, averages, etc. Also included are 2 sample reports based on the view. Take a look at admin/structure/report-builder.
Known Issues
Report Builder should work well with all of the basic core form elements. Elements that are nested within other elements (i.e. the date API date picker within its container div) don't maintain their state in the report builder interface. It's in the pipeline!
Roadmap
1) Integrate the Entity API for more Drupaly entity goodness instead of homebrewed CRUD
2) Add a plugin system for display plugins (not just tables or Chart API charts)
3) Make reports have more than one row of data.
Mainteners
This module is maintained by mkadin. I would love to have some help if you're interested!
This module was developed with support from Merlin Education.
Project information
Unsupported
Not supported (i.e. abandoned), and no longer being developed. Learn more about dealing with unsupported (abandoned) projectsNo further development
No longer developed by its maintainers.13 sites report using this module
- Created by mkadin on , updated
This project is not covered by the security advisory policy.
Use at your own risk! It may have publicly disclosed vulnerabilities.
Releases
Development version: 7.x-1.x-dev updated 30 Mar 2012 at 00:43 UTC


