
 Come together with the global Drupal community in Rotterdam, 28 Sept – 1 Oct 2026. Sessions, contribution, connection, and Early Bird savings until 8 June.
First off, fantastic module. It is exactly what has been needed for easy Drupal charting based on the Google Charts API. I knew exactly what I needed to do in Views after enabling this module, and it worked flawlessly the first time.
I started poking around in the code, and it is surprisingly straight forward. What would it take to have the Geo Charts available in the module? Here's the introduction page for the Geo Charts: https://developers.google.com/chart/interactive/docs/gallery/geochart
There are two types of Geo Charts, region and marker. The regions type could certainly be useful for something like Drupal Commerce, but I'm sure there are plenty of use cases for the marker type too.
I'm hoping this isn't too much of a challenge, but I'm happy to contribute what I can. And, thank you, thank you, thank you, so much, times a millions, for this module!
| Comment | File | Size | Author |
|---|---|---|---|
| #6 | views_dataviz-geochart.patch | 4.02 KB | jlab |
| #2 | 1351979221784.jpg | 27.09 KB | mobonobomo |

Comments
Comment #1
mobonobomo commentedWell, I got a decent start, and it was actually pretty easy. Here are my notes that I will roll into a patch, this got me to at least somewhat working geo charts!
In views_dataviz.module
at line 39:
'Gauge' => t('Gauge'),
'GeoChart' => t('Geo chart'),
'LineChart' => t('Line chart'),
In views_dataviz_plugin_style_dataviz.inc
at line 19:
$options['_pieSliceText'] = array('default' => 'value');
$options['_displayMode'] = array('default' => 'region');
$options['_region'] = array('default' => '');
$options['_resolution'] = array('default' => 'countries');
$options['_width'] = array('default' => '');
at line 71:
'#default_value' => $this->options['_pieSliceText'],
);
$form['_displayMode'] = array(
'#type' => 'select',
'#dependency' => array(
'dataviz-chart-type' => array('GeoChart'),
),
'#title' => t('Display Mode'),
'#description' => t('The display mode for the Geo Chart.'),
'#options' => array(
'region' => 'region',
'markers' => 'markers',
),
'#default_value' => $this->options['_displayMode'],
);
$form['_region'] = array(
'#type' => 'textfield',
'#dependency' => array(
'dataviz-chart-type' => array('GeoChart'),
),
'#title' => t('Region'),
'#description' => t('The region on which to focus for this chart, ex: US for the United States. Leave blank to not focus on a specific region. Acceptable formats include 3-digit numerics for continents, ISO-3166-1 alpha-2 codes, and ISO-3166-2:US states codes like US-AL.'),
'#size' => 6,
'#required' => FALSE,
'#default_value' => $this->options['_region'],
);
$form['_resolution'] = array(
'#type' => 'select',
'#dependency' => array(
'dataviz-chart-type' => array('GeoChart'),
),
'#title' => t('Resolution'),
'#description' => t('The resolution at which to draw borders. Provinces work for U.S. states and some other country regions.'),
'#options' => array(
'countries' => 'countries',
'provinces' => 'provinces',
),
'#default_value' => $this->options['_resolution'],
);
$form['_width'] = array(
'#type' => 'textfield',
at line 144:
if (empty($views_dataviz_log)) {
drupal_add_js('if (!Boolean(Drupal.settings.Dataviz)) { Drupal.settings.Dataviz = new Object(); } if (!Boolean(Drupal.settings.Dataviz.chart)) { Drupal.settings.Dataviz.chart = new Object();google.load("visualization", "1", {packages:["corechart", "gauge", "orgchart", "geochart"]}); }', 'inline');
drupal_add_js('https://www.google.com/jsapi', array('type' => 'external', 'weight' => JS_LIBRARY));
Comment #2
mobonobomo commentedUsing the above modifications, setting region to "US" and resolution to "provinces", I constructed a view using my Address field (or rather, just the U.S. state aspect), and filtering the results to the U.S. only, I can make a nice heatmap like this:
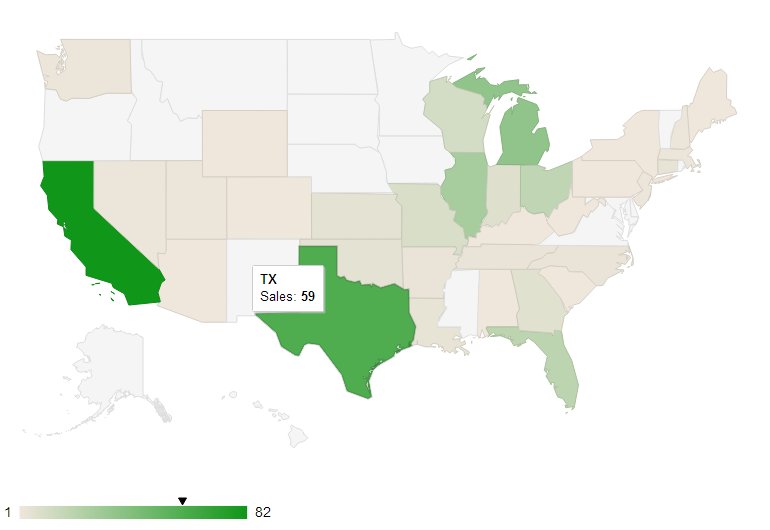
There are only about 400 nodes here, so there isn't as much of a gradient as there might be.
Comment #3
jaysonjaynes commentedHey, did you develop a patch for this? If so, can you post it? This is exactly what I need.
Comment #4
mobonobomo commentedSorry for the delayed response, I have just been slammed with work. I will try to get one rolled up soon... Is there a quick and easy way to do it?
Comment #5
ganesh101 commentedThanks mobonobomo. it works for me.
Comment #6
jlab commentedI have created a patch from the code provided by mobonobomo in #1
Patched against 7.x-1.0-alpha3
Can be patched using:
patch -p1 < views_dataviz-geochart.patch
in the views_dataviz module folder.