
This project is not covered by Drupal’s security advisory policy.
A community contribution by http://www.sooperthemes.com/#-Drupal-Themes
Video demo: http://www.youtube.com/watch?v=L1-9-fgXRJg
Great Tutorial: http://www.youtube.com/watch?v=1OLsNA8ef_E
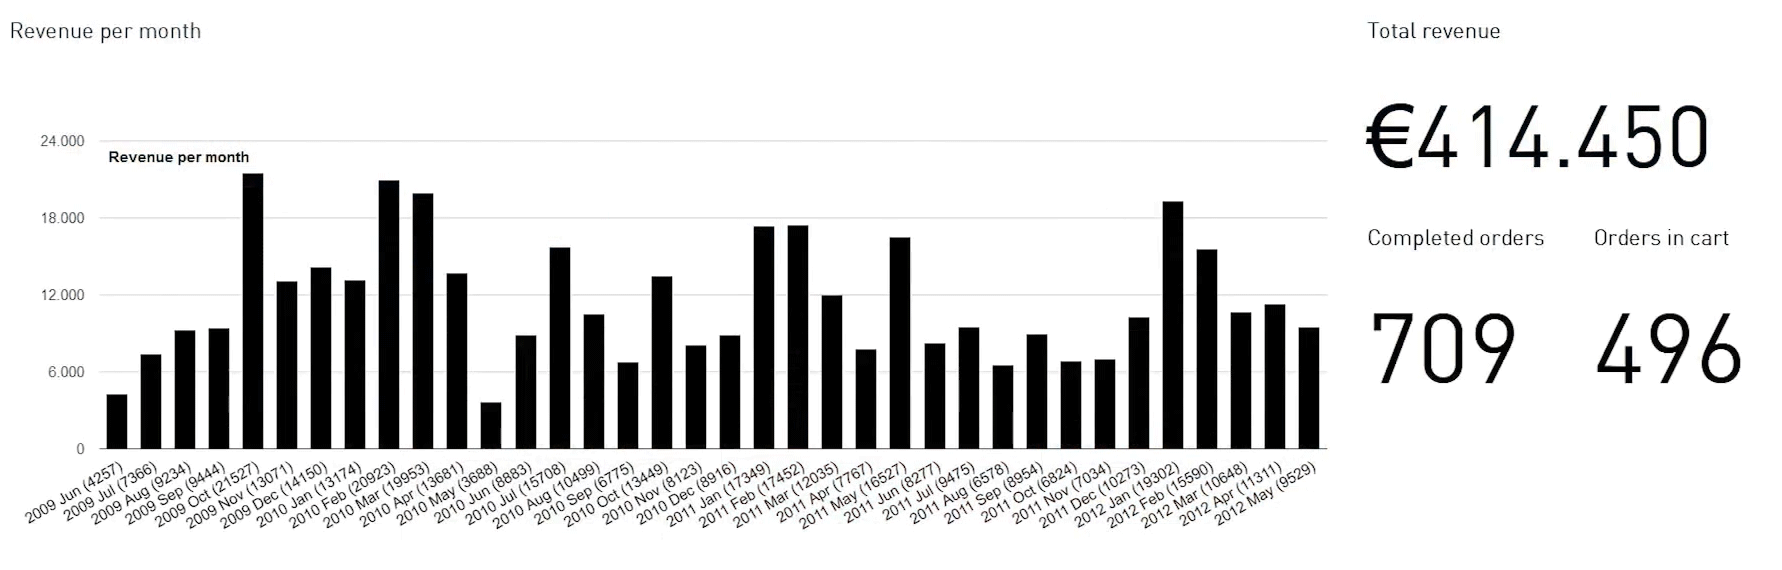
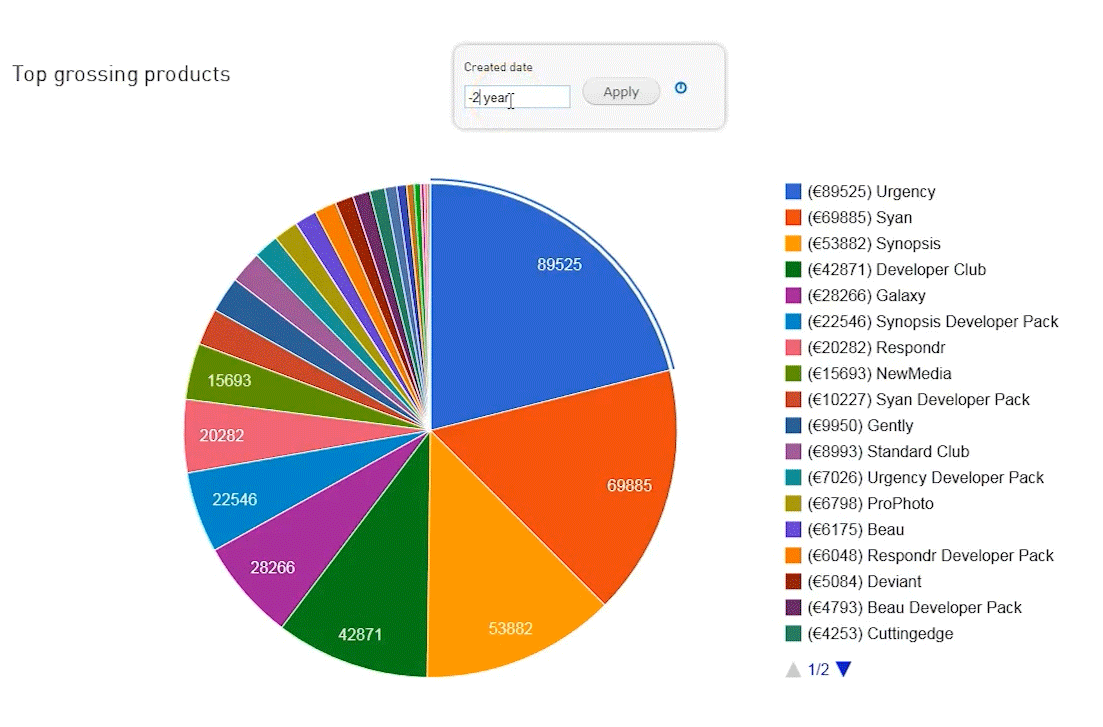
Data visualization for views. Supports charts and "BigText" in views. I made this module as a backend for my Drupal Commerce dashboard.
Tips
- It's important that the module is supplied with numeric values, this means you need to select unformatted fields in Views.
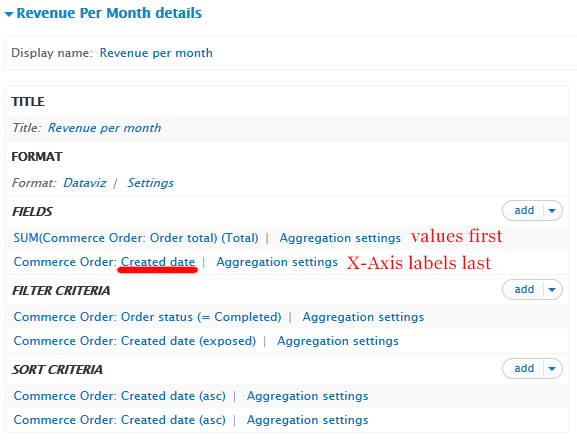
- If you're trying to get total amounts per month/week etc. you need to use views in aggregation mode, as explained in the video tutorial that is linked above. You will probably also need the views_date_format_sql module and use it as depicted in this screenshot:

- If you're trying to Chart Drupal Commerce monetary values you need the latest dev of this module so that unformatted values are available (even with multicurrency set-ups).
Why another module for charts?
I needed something that works and I needed it quick. Other modules don't support one or more of the following:
- Interactive charts that work on iPad/iPhone. This module uses Google Visualization API which is HTML5/SVG
- I had to start from the ground up to get a module that's built to be compatible with AJAX blocks and live data. It required a Drupal/views integration with a different approach.
- Drupal 7
- Views 3
- Views aggregation
Dependencies
- Views
New
The latest dev version now supports multiple data series. When using the latest dev it's important the the X-axis labels are the last views field. Views field ordering is used for semantic header/values detection. Example: http://drupal.org/files/screeni_0.png
Tags
Views charts, views data visualization, drupal google visualization api, google charts, views graphs, views infographics, ajax charts, ajax graphs, drupal 7 charts
Project information
 Unsupported
Not supported (i.e. abandoned), and no longer being developed. Learn more about dealing with unsupported (abandoned) projects- Obsolete
Use of this project is deprecated.  58 sites report using this module
- Created by jurriaanroelofs on , updated
 This project is not covered by the security advisory policy.
Use at your own risk! It may have publicly disclosed vulnerabilities.


