
 Come together with the global Drupal community in Rotterdam, 28 Sept – 1 Oct 2026. Sessions, contribution, connection, and Early Bird savings until 8 June.
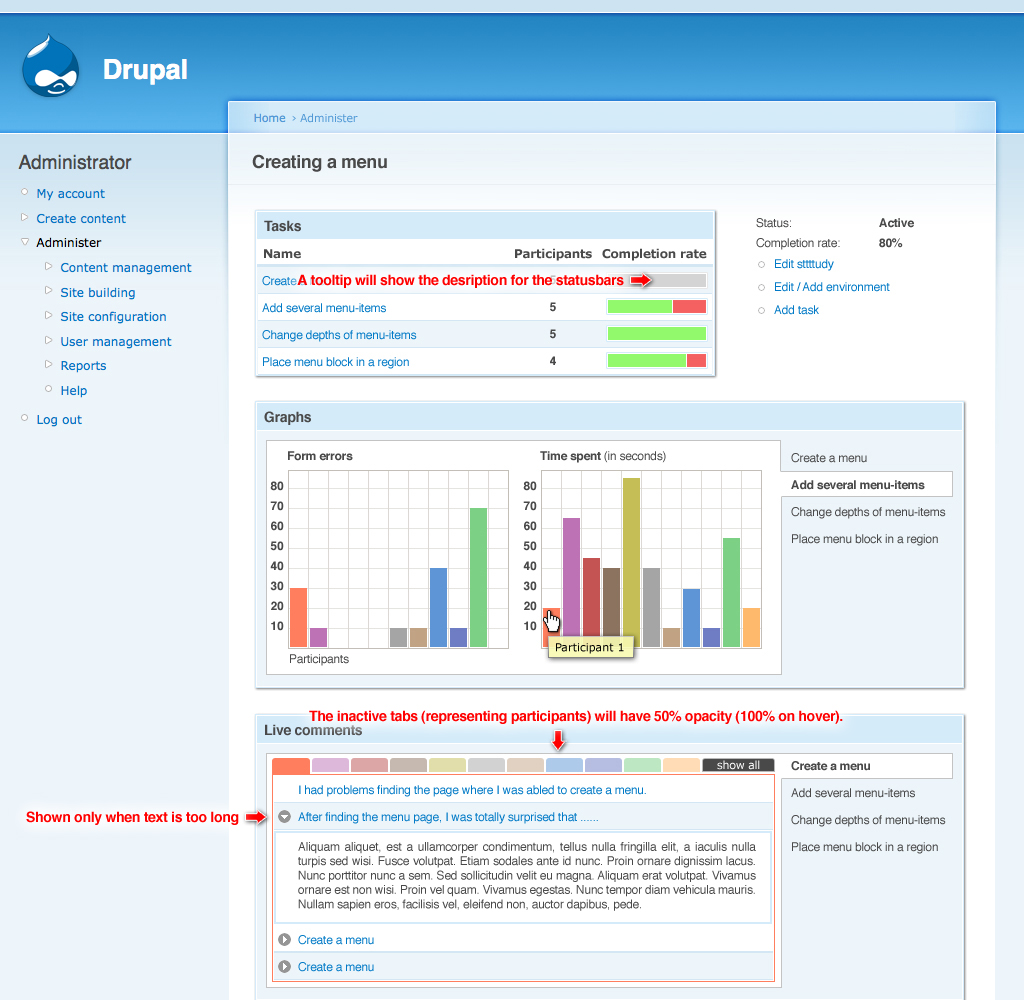
Here's the mockup for the Study page Bojhan and I came up with.
| Comment | File | Size | Author |
|---|---|---|---|
| #24 | uts_study_dashboard2.png | 4.22 KB | boombatower |
| #22 | uts_study_dashboard_spelling.patch | 784 bytes | boombatower |
| #20 | uts_study_dashboard_rev1.patch | 13.25 KB | Bojhan |
| #18 | uts_study_dashboard.patch | 12.85 KB | boombatower |
| #17 | uts_study_dashboard.patch | 12.44 KB | boombatower |

Comments
Comment #1
boombatower commentedErr...what about #307518: dashboard with studies? I assume this is the same issue. If so please move this over to the other issue as a comment and I'm marking this one as a duplicate.
Comment #2
Bojhan commentedNo isn't, see http://drupal.org/node/308140.
Comment #3
yoroy commentedComment #4
Bojhan commentedInteresting, I am unsure if a harmonica is the best way to go, simply due to the fact that on default we will be hiding the most important information on the page. What benefit is there in using a harmonica? Apart from not having double indicators?
The important information is the group behaviour, however the show all only really applied to live text, since the graphs displayed all participants. I would agree, that show all would be better on default.
Comment #5
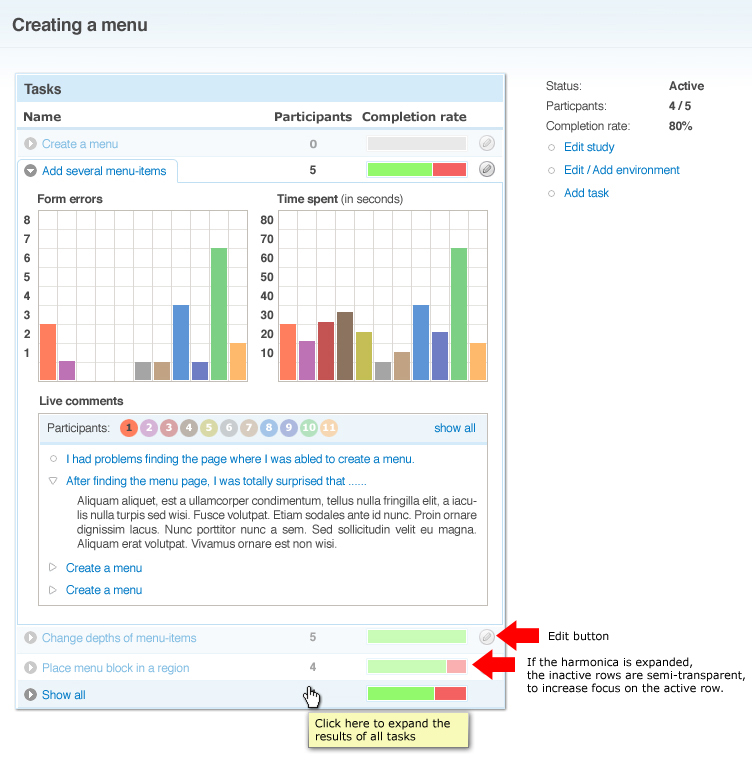
skilip commented@yoroy: I really like the idea of the harmonica, but what if you want to evaluate the results of all tasks? Another problem is the graphs. For the graphs it isn't very helpful to view the result of only one participant. So there should be a separation of what is useful to view per person, and what isn't. Another addition feature I would like to see is an 'edit' button on each task.
Oh, and why did you remove the 'Add task' link?
@bojhan: We could expand the 'Show all studies' by default! So on page load, the results of the whole study is visible.
How do you get your images inside your posts yoroy? Do I need some kind op magic spell for that?
Comment #6
yoroy commentedharmonica is mainly to remove the double indicators.
I had trouble figuring out what is 'overall info' and 'per participant' info in your mockups, so any inconsitencies I introduced are just another way of saying that we need to better separate the two.
"show all" as the default expanded view of the harmonica is what I think would be good yeah.
Didn't remove the add task link on purpose :-)
Comment #7
skilip commentedHere're our new thoughts on the layout for the UTS Dashboard: #307518: dashboard with studies
Comment #8
skilip commentedHere's the PSD.
Comment #9
eigentor commentedHas someone been thinking about simplyfying the path and form submission tabs? To me ideal would be to unify all this and also put in a time stamp. At the moment there is lots of Information in the path view one does not need, the path alone should be enough. The code view of the form submission must be turned into something human readable. Sorry for me being too lazy today to provide a mockup ;)
Comment #10
Bojhan commentedNot sure what you mean eigentor.
Comment #11
eigentor commentedUnluckily I don't get to work UTS completely on my latest installation, so I do not get Data and also there is nothing to Analyze.
But the last time I was in there, there was a Tab for the path the user took. Each row in this table was very high and had lots of Data, so it was difficult to follow the path easily.
Also Form submissions were represented by some SQL-Query-like Code, and this was under another tab.
As I do not know what it looks like now I cannot say, but if it is similar it should be simplified to utmost reduction and readability, Form Submissions have their place in the path on the place they orrured.
Comment #12
boombatower commentedIs #5 ready to be implemented?
Comment #13
Bojhan commentedYup, make the edit button a link for now.
Comment #14
dmitrig01 commentedi might be able to tackle this, but what page is it on?
Comment #15
Bojhan commentedadmin/uts/analyze/[idtask]
Comment #16
boombatower commentedgetting started...
Comment #17
boombatower commentedThis code is fully functional (even has a number of slick interface extras), but like the previous issue does not look identical. We can fine-tune the looks later as that is rather time consuming.
Comment #18
boombatower commentedCommitted.
Comment #19
Bojhan commentedComletion rate?
Comment #20
Bojhan commentedThere you go, fixed it :D
Comment #21
boombatower commentedComment #22
boombatower commentedGood catch.
Comment #23
skilip commentedLooks promising! Do the graphs actually work? And how about 'live feedback'? Any screenshots of that?
Comment #24
boombatower commentedYes, the graphs actually work and I have attached a shot with the live feedback show. It doesn't demonstrate it very well since both of the comments are one work, but it works as you described. The comments open/close in an accordion style.
Comment #25
eigentor commentedHm, I do not get the graphs working, but this might be du to my issue of not getting the dev release working at all :D When I click on the little colored buttons for "Analyze participant" like shown in #24, it gives me a URL like this http://auweia.org/admin/uts/analyze/15/uts51307 and tells me Page not found.
May there be a problem that the new version cannot use Data recorded with an older one? (last beta).
Comment #26
boombatower commentedYou need to expand the individual task areas for feedback...otherwise you will be analysing a specific participant.
Comment #27
eigentor commentedWell, doing this, it takes me to the task itself - no graphs to be seen thereof course.
Comment #28
boombatower commentedThe graphs are related to tasks no participants therefore you need to click the little arrow to extend the the task non on the participant squares.
Comment #29
eigentor commentedah found it now.
This looks great. Graphs on Drupal, wow...
Hehe, we got a Usability Problem there. I would not have expected that the little triangle leads to something different than clicking the text. Would't it make sense to link the text to the graphs, too? I would expect anyone else to fall into this pit the same as I did.
Comment #30
boombatower commentedSure, open a new issue so I remember.