
Active
Project:
Project
Version:
7.x-2.x-dev
Component:
Usage statistics
Priority:
Normal
Category:
Feature request
Assigned:
Unassigned
Reporter:
Created:
25 Dec 2008 at 03:10 UTC
Updated:
21 May 2019 at 07:39 UTC
Jump to comment: Most recent, Most recent file

Comments
Comment #1
drewish commentedmarked #352059: decreasing usage stats as duplicate.
Pasqualle, I don't think that "false information" or "false statistics" are accurate descriptions of what's happening here. There's always going to be variation in the statistics because of the way that they're gathered. With a smaller number of sites the chart makes it much more pronounced that if you were just looking at the table.
That said, the numbers for Dec 21st are down on every module so I'm wondering if there was downtime on d.o or if the processing script didn't finish.
Comment #2
dwwProcessing script finished on Sunday, December 28, 2008 - 1:11 GMT and claimed all was well. I searched for PHP error log messages during that time range and there were none.
The only thing of interest that I saw looking at the logs is that we've filled up the window of daily data we're willing to save, and now the daily processing runs are removing old rows again. It's *possible* there's a bug in the processing code that's somehow over-counting by using stale data, and as the data times out and is purged, we're seeing things drop again? Seems incredibly far-fetched, especially since all the processing SQL is full of datestamp logic that we've gone over multiple times.
One possible explanation is that a non-negligible fraction of the usage data is from test sites, and deployment of test sites dropped off sharply over the holidays.
Another (probably more likely) explanation is that the DB was in fact having problems at some point and when sites would check for updates, the script that's supposed to record the ping couldn't write to the DB. We're not checking the return values from the INSERT/UPDATE queries in there. If those failed, we might be dumb enough to try to watchdog() about the error. ;) (I just checked, and for better or worse, there are no calls to watchdog() anywhere in project-release-serve-history.php). See #352435: Check for errors recording usage stats to the DB and write a log file to the filesystem for more.
I'm tempted to just close this request. Given the current lack of hard data to support any of these theories, there's not much to be done, other than work on #352435 so we can at least start to rule that out.
Comment #3
pasqualleThe big difference between the 2 issues is that issue #352059: decreasing usage stats happens for all projects on the same exact date, and this issue happens for all projects but on different dates. So I hardly believe that they are duplicate.
Please don't close the issue with an answer: "we don't know the reason".
Comment #4
dww"Please don't close the issue with an answer: "we don't know the reason"."
Then please help in the other issue. No one is funding my time to work on any of this, and I have very limited "free" time to spare. The D6 upgrade of d.o is vastly more important than fluctuations in the usage stats, which are provided as a completely optional extra bonus. Nothing depends on this data being accurate. We already know it's wildly inaccurate in the first place, since it depends on sites that run update_status, which is only a (completely unknown) fraction of total Drupal sites.
If you'd rather, I could simply turn them all off again so their fluctuations didn't bother you. ;)
Comment #5
aclight commented@dww:
This was my initial reaction as well, and I think an analysis of the data is consistent with this hypothesis.
Actually, the usage does not drop for *all* modules, as originally reported. I did an analysis of the data displayed at http://drupal.org/project/usage. I calculated the % change in usage from the week beginning Dec 14 to the week beginning Dec 21. I then took this % change value for the top 1000 modules (based on the usage numbers from the week beginning Dec 21) so that modules with very few users wouldn't skew the analysis. The least popular module I included (number 1000) is used on ~100 sites, so this cutoff seems appropriate to me.
I then plotted a histogram of this data (from the top 1000 modules) and have attached that here as usage_changes.png. The bin width was set to be 1%. The y axis shows the # of modules in a given bin, and the x axis shows the % change from the previous week. As you can see, there are a substantial number of modules which gained usage over this time period, though overall many more modules lost usage than gained usage. In fact, 108 modules had a positive percentage change over the week while 892 modules had either zero change or a negative percentage change over the week.
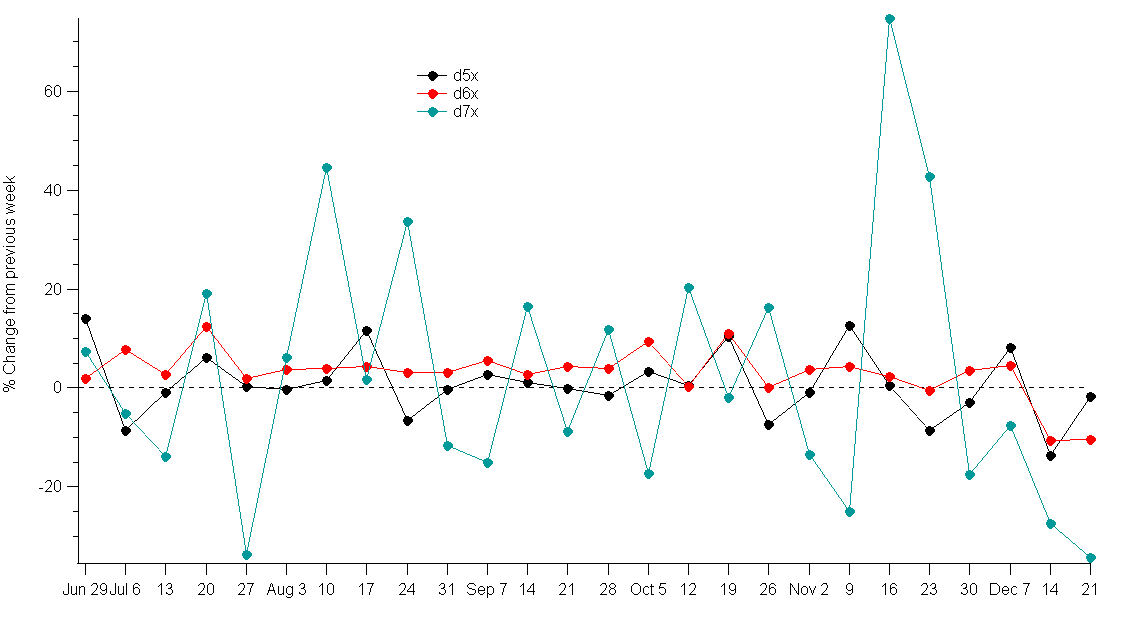
I then wondered whether the % change from the week of Dec-14 to the week of Dec-21 varied by core version. Based on my understanding of how the usage data is processed and stored, if this drop is due to a database problem or failure of the script, I would expect that such a problem would affect the usage data from all Drupal core versions equally. In other words, usage for Drupal 5.x, 6.x, and 7.x would all be expected to drop by a similar amount (in terms of percent change). I took the data from the usage by core version table at the bottom of http://drupal.org/project/usage/drupal and calculated the % change in usage from the previous week for each week. That data is shown in the attached file drupal_core_usage_changes.png. As you can see, the % change from the previous week fluctuates quite a bit for all versions. For Drupal 6.x, it is almost always positive, however the change in usage has been negative for the previous two weeks. For Drupal 5x, the change for the previous two weeks was also negative, but for the most recent week not as negative as for D6x and D7x. My guess is that a greater proportion of test/development sites are running D6 (or D7) right now, so I'm not surprised that the drop in usage of D5 sites over the past two weeks has been less than that of D6 sites, on a percentage basis.
It's really difficult to prove any of this, since as far as I know we don't have any way to know what happened for real. As dww mentioned, it could be due to problems in the code that logs hits or processes hits, but since that code doesn't log errors like we'd like it to we will never know. However, I'm pretty comfortable with the conclusion that these fluctuations are likely due to seasonal/holiday effects, and don't necessarily indicate that there is a problem with the project_update module itself. Therefore I'm setting the status back to fixed. Lets wait a few weeks and see how things go after the holidays are over. If we continue to see drops across the board for a longer period of time, that's evidence that there may indeed be a problem.
Comment #6
pasqualleI am absolutely not convinced about the original issue, which you quite ignore:
there is a 30% increase on nov 9 and 20% increase on dec 7. I know that 6700 as usage count for statistics is not much, but that module is inside the top 20 projects, so I have no better example that something must be wrong here..
The theory of wrong db updates as dww said (#352435: Check for errors recording usage stats to the DB and write a log file to the filesystem) is more likely, but it is not a missing count, the project must be counted twice or more times, so logging them into separate file will not help. (I should write this into the new issue, sorry)
I don't ask to solve any problem right now for me, I am just curios about the answer. I am almost sure that you will be able to tell the exact answer after some time pass..
Comment #7
dww@aclight: Rock on with your badass data analysis self, dude! ;) Thanks!
@Pasqualle: re spikes -- there's some code in place that tries to record enough data to detect "abuse", but we haven't written any code that actually attempts to analyze this data and see if there are cases where a large number of sites are showing up from a small number of IP addresses, etc. It's entirely possible that someone was trying to game the system for a few weeks. Or, again, that someone rolled out a large number of test sites via some automated system (someone playing with aeger/hostmaster, etc). If anyone is interested, see #352585: Write code to analyze IP vs. sitekey in usage data to detect possible abuse.
Comment #8
aclight commented@Pasqualle: You think that the Nov 9 and Dec 7 data for the D5 series of the tinymce module may be invalid. You may be right. But also note that, according to http://drupal.org/files/issues/drupal_core_usage_changes.png, those dates showed a fairly substantial positive change in the D5 core usage as well. The change in Drupal core usage was not as large as the change in tinymce, but it's reasonable to think the two are correlated.
To be honest, when I wrote my comment #5, I thought I was responding to #352059: decreasing usage stats, not this issue. But in either case, I suspect that these are just normal fluctuations.
Comment #9
pasqualle@aclight: thanks for pointing out the spikes in D5 on those dates. That makes sense.
These usage statistics are more complicated than I thought..
Comment #10
pasqualleequal increase +1200 for D5 modules on dec 21
http://drupal.org/project/usage/taxonomy_breadcrumb
http://drupal.org/project/usage/adsense_injector
http://drupal.org/project/usage/InsertNode
http://drupal.org/project/usage/textlinkads
Comment #11
drewish commentedhumm, very interesting. i wonder if someone has a provisioning system that's enabling a large number of sites at once with those modules enabled. it would be worth watching for future spikes like that.
Comment #12
hass commentedOn 28th Dec 2008 the stats fall down to 0... see http://drupal.org/project/usage/google_analytics
Comment #13
hass commentedComment #14
hass commentedSeems to be a d.o issue... my local install works fine.
Comment #15
pasquallethe zero stats could be a result of unplanned restart (or other problem(s) with infrastructure) as it happened again on the last week..
Comment #16
hass commentedWe should be able to re-run failed jobs... maybe implement job_queue as already said somewhere else that this would be a good module for d.o. cron issues.
Comment #17
xanoWith hass. The statistics should not depend on how the scripts are run. If something goes wrong, the script should continue where it stopped next time. It's possible to lose a few stats, but definitely not all.
Comment #18
dwwGreat, then y'all can write the code to do so. I'm busy.
Comment #19
babbage commentedI think there is convincing argument here and in #352059: decreasing usage stats that week-by-week fluctuations where data is reported are likely accurate and not a result of failure in the update status module or in d.o processing.
However, now in three of the last five weeks no data has been reported for any module or core version at all. There is clearly a bug there.
I absolutely 100% understand dww and others are fully busy with the D6 port of the module and of d.o. I have therefore marked this as "Priority: minor" since while it is a pretty significant bug in the operations of reporting usage statistics, it is minor in the grand scheme of things. I am also renaming the issue to focus on the bug that does seem to exist. This moves the thread away from the original post, but reflects the discussion that is already here and seems more sensible than making an entirely new thread. The change to the direction of this thread is also why I marked #352059: decreasing usage stats as no longer being a duplicate of this thread.
At some point I would be happy to try and figure out what is happening with this bug. I am wondering however whether it will be possible for anyone to troubleshoot this issue without access to the d.o infrastructure to confirm what is actually happening—which may mean it cannot happen until after the D6 port is complete. So wondering if this should be marked "Postponed" but I won't do that myself—someone else can make that call.
Comment #20
babbage commentedUsage statistics are now running on the D6 staging site: #362134: Port project usage statistics to Drupal 6
http://d6.drupal.org/project/usage
Presumably given other pressures, the next thing is to wait for the end of the next week of usage statistics, and see if the D6 version of the module+process is having the same issues as the current live version. That would both help triangulate the problem and may make it less important if it is fixed in D6, depending on the planned roll-out timing of the D6 upgrade?
Comment #21
dwwI once caught the bug in action. The problem is that sometimes during the big nasty expensive weekly processing runs, the giant query we're doing times out, fails to write to the DB, and we get 0s for the weekly summary counts. nnewton and I were hoping to have time to look into it closely at the sprint, but our hands were full with more urgent tasks.
One thing is that the script should attempt to recover from failure and retry or something.
It should also probably partition these big nasty queries into smaller pieces that are less likely to timeout.
It's also possible that the whole processing operation could be refactored and the schema reorganized to perform better.
Comment #22
drewish commentedI think the D6 version will suffer from the same problems as the D5 version since only very minimal changes were made.
Comment #23
babbage commentedJanuary 25th statistics have now populated, having previously been blank. Did someone fix something? :)
Comment #24
greggles@dbabbage - I don't believe so (note that there are weeks since without data). Also note that the bug is not consistently present which is part of what makes it hard to fix.
Comment #25
pasqualleThe bug is quite present now, as there was only one stat after Dec 14 2008. dww had to rerun the script twice to generate the data..
Comment #26
markus_petrux commentedNot really sure how this works internally, but maybe one possible method would be as follows:
- Add a timestamp to the table that stores these stats per project that tell the last time the counter was updated.
- During the process that runs these queries, sort by this timestamp so the last processed project is updated first.
- Such process could just update a few projects per execution and make sure only those that have not been updated for X hours need to be processed.
This would allow partitioning of the update stats processing into small units where just a few projects are processed.
I'm doing this on a site to compute the popularity of user blogs based on complex processing for each one. The process is spread around the whole day, processing a few at a time.
Comment #27
drewish commentedI talked with nnewton at DrupalCon about this. We really need to ditch the daily table and have the insert round the timestamp to the weekly value then do a MySQL specific INSERT ON DUPLICATE KEY UPDATE. dww seemed willing to make the project_usage.module MySQL specific.
Comment #28
dwwThere are a lot of things we can/should do here:
A) Move the "raw" and "partly cooked" data into a completely separate DB.
B) Use week-specific tables for the "daily" data so we never have tables that grow insanely large, and to make it easier to archive and then drop the tables from older weeks. We wouldn't even store the timestamp -- it'd be determined by which table you inserted into (which would also ensure we don't have duplicate records that we need to DISTINCT out of the way when processing summaries).
C) Forget about {project_usage_raw} entirely, and parse the apache transferlog files (which contains everything we need, anyway) from updates.d.o instead. Then, we could serve update XML without a php script at all, the daily data gets rotated/archived automatically, etc, etc. Now that updates.d.o is its own site, this is a lot easier than it ever would have been in the past with the apachelogs of all of d.o.
Comment #29
babbage commentedLooking forward to this progressing. Moving back to "normal" now the d.o D6 upgrade is done... :)
Comment #30
markus_petrux commentedHere's a snippet that applies the logic described in #26:
Not sure if it's applicable here. I hope that helps.
Comment #31
icecreamyou commentedYou use $current_time in the SQL query before you declare it... not sure why you wouldn't just use time() instead of $current_time wherever you need it though.
Comment #32
dwwPlease, no one waste any more time trying to fix this. It's already solved, it's just blocked on nnewton having a chance to do some big DB operations. He's been really sick since DC when we worked out a bunch of this. We'll fix it as soon as he has time and energy to do so.
Comment #33
michelleThanks for letting us know, dww. I keep looking at the stats every day wondering if they're coming back. Great to know it's just a matter of time. :)
Thanks for all the hard work!
Michelle
Comment #34
markus_petrux commentedDitto as Michelle. Thank, dww.
@IceCreamYou: $current_time is also used in the UPDATE statement, I just pasted the lines in the wrong order because I extracted from code I use somewhere else. I'll fix it now, just in case someone else look at it.
Comment #35
hass commented@dww: Great. Are you be able to repair the zero counters we see since December or are these statistics lost and you can only fix for future?
Comment #36
dwwhttp://drupal.org/project/usage/drupal
For future optimizations, we'll use new issues.
Comment #37
pasqualleThank you Derek and everyone involved.
Comment #38
michelleIs this broken again?
Michelle
Comment #39
hass commentedSeems to be broken again. 2 Weeks without any data.
Comment #40
dwwThe cron job was still disabled. ;) Backed up everything, ran the script manually (all went fine) and enabled the cron job. This should be resolved now. There's still lots of optimizations that need to happen, but those are for other issues. Die, #351002, die! ;)
Comment #41
michelleThanks again, dww. Now that we have stats, I don't know how I lived without them for all those years! LOL
Michelle
Comment #42
hass commentedLOL, same here... It's great to know - for how many sites/people we are running on our modules and the usage growths... versus how few issues are in a queue :-)
Comment #44
pasqualleok, any idea how we can better detect "abuse" or buggy statistics?
~ +8000
http://drupal.org/project/usage/block_class
http://drupal.org/project/usage/viewreference
http://drupal.org/project/usage/simplehtmldom
http://drupal.org/project/usage/deploy
http://drupal.org/project/usage/glossify
Comment #45
bdragon commentedYeah, yeah, I saw.
Someone had a bug in one of their test sites that was making it forget its site key every cron run, so it was showing up as a new site every time it checked in. (It is assumed to be accidental and the responsible party was contacted. They appear to have fixed their end, so we shouldn't be seeing further issues.)
I stripped those out of the statistics a minute ago.
In "The new system" (which isn't posted yet but is currently responsible for the stats) I just added keeping track of the IP for each site object for as long as possible (instead of discarding it like the old system did during raw -> day moving.) It doesn't do anything with it but it makes it a lot easier to debug.
I suppose it would be possible to detect sudden extreme jumps in the number of site keys from an IP. Got any ideas for math that wouldn't have false positives? (Or possibly just send off a report every week with the top 10 increases in site keys per IP.)
Comment #46
ron williams commentedI had considered posting a new issue, but this task seemed reasonable. After looking at the latest stats, it appears that quite a few modules (if not all) had 0 usage last week. Obviously http://drupal.org/project/usage/views is wrong.
Comment #47
AlexisWilke commentedHmmm... This is all neat but it doesn't explain the huge spike going UP that I saw a while back. #728736: Popularlity modules statistics spikes
Although it was an interesting read and I would assume that a hacker doing such a thing wouldn't make sense, especially to many modules that they do not own...
My current idea of the problem I saw then was possibly due to many programmers having more time at the end of Dec. and beginning of Jan. and they then test many other modules, many of them all at the same time. However, as mentioned in one of the posts, we, the people, cannot really know since we don't have access to the data to peruse and see whether that assumption would be correct.
Someone mentioned the idea/concept that some data was counted multiple times. From 500 to 1200 it would be counted about 2.4 times...
In regard to checking for the IP address, there could be a problem as many websites will share the same server (shared webhosting is quite common!) This means all those websites will have the same IP and thus counting them all as 1 would be as wrong as counting all the accesses blindly. (not like I have a great solution for that problem, just mentioning.) I would instead use the domain name. Of course, you have many people using sub-domains for all sorts of things, but the cron.php is probably not running of each one if the all represent one website (i.e. if you have en.example.com and fr.example.com then there should still be only one cron calling say www.example.com and that only will be counted.)
Anyway, all that being said, it has been working a lot better lately. 8-)
Thank you.
Alexis Wilke
Comment #48
avpadernoI am changing version, since the Drupal 6 version is not supported anymore.