
 Come together with the global Drupal community in Rotterdam, 28 Sept – 1 Oct 2026. Sessions, contribution, connection, and Early Bird savings until 8 June.
Decided to compare node/1 between Drupal 7 and Drupal 6. To give some semblance of a level playing field, I put return array(); at the top of menu_contextual_links() since that's our single biggest recent performance regression, and we should have a killswitch / permission for it soon which will do much the same thing. Note the dbs were different, different modules enabled etc., this is just to get an idea
Highlights:
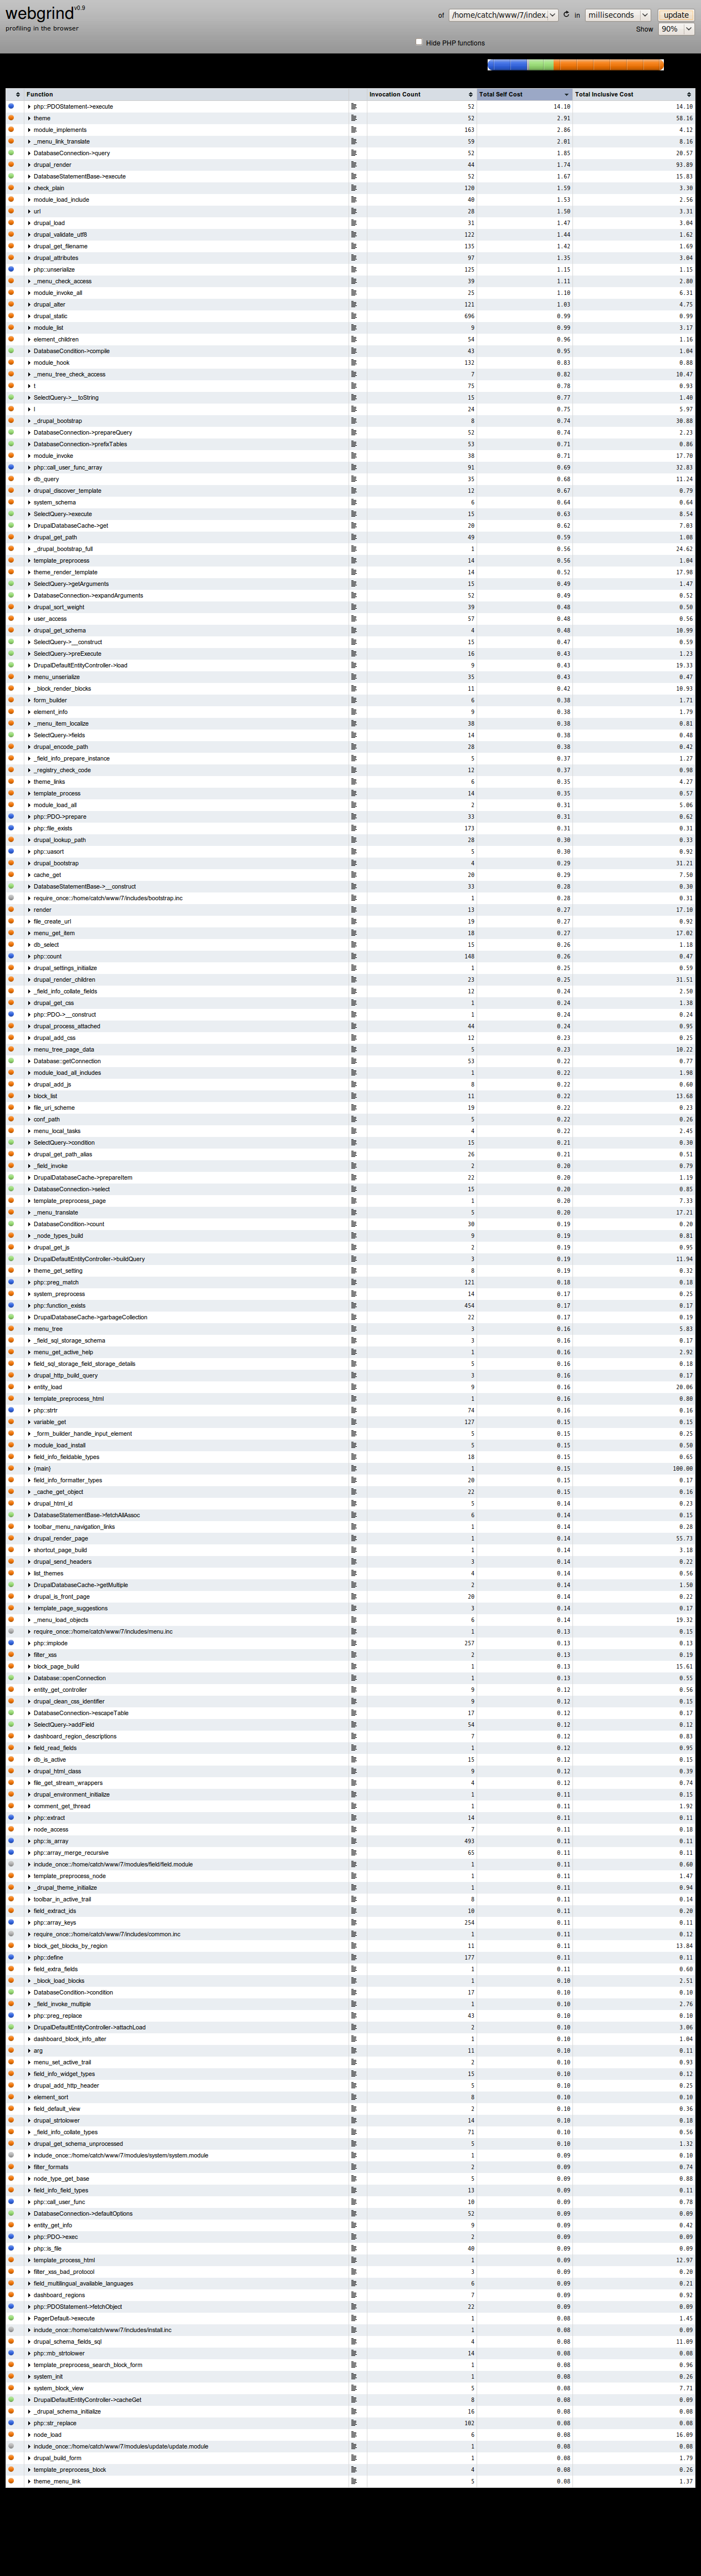
7: 764 different functions called in 335 milliseconds
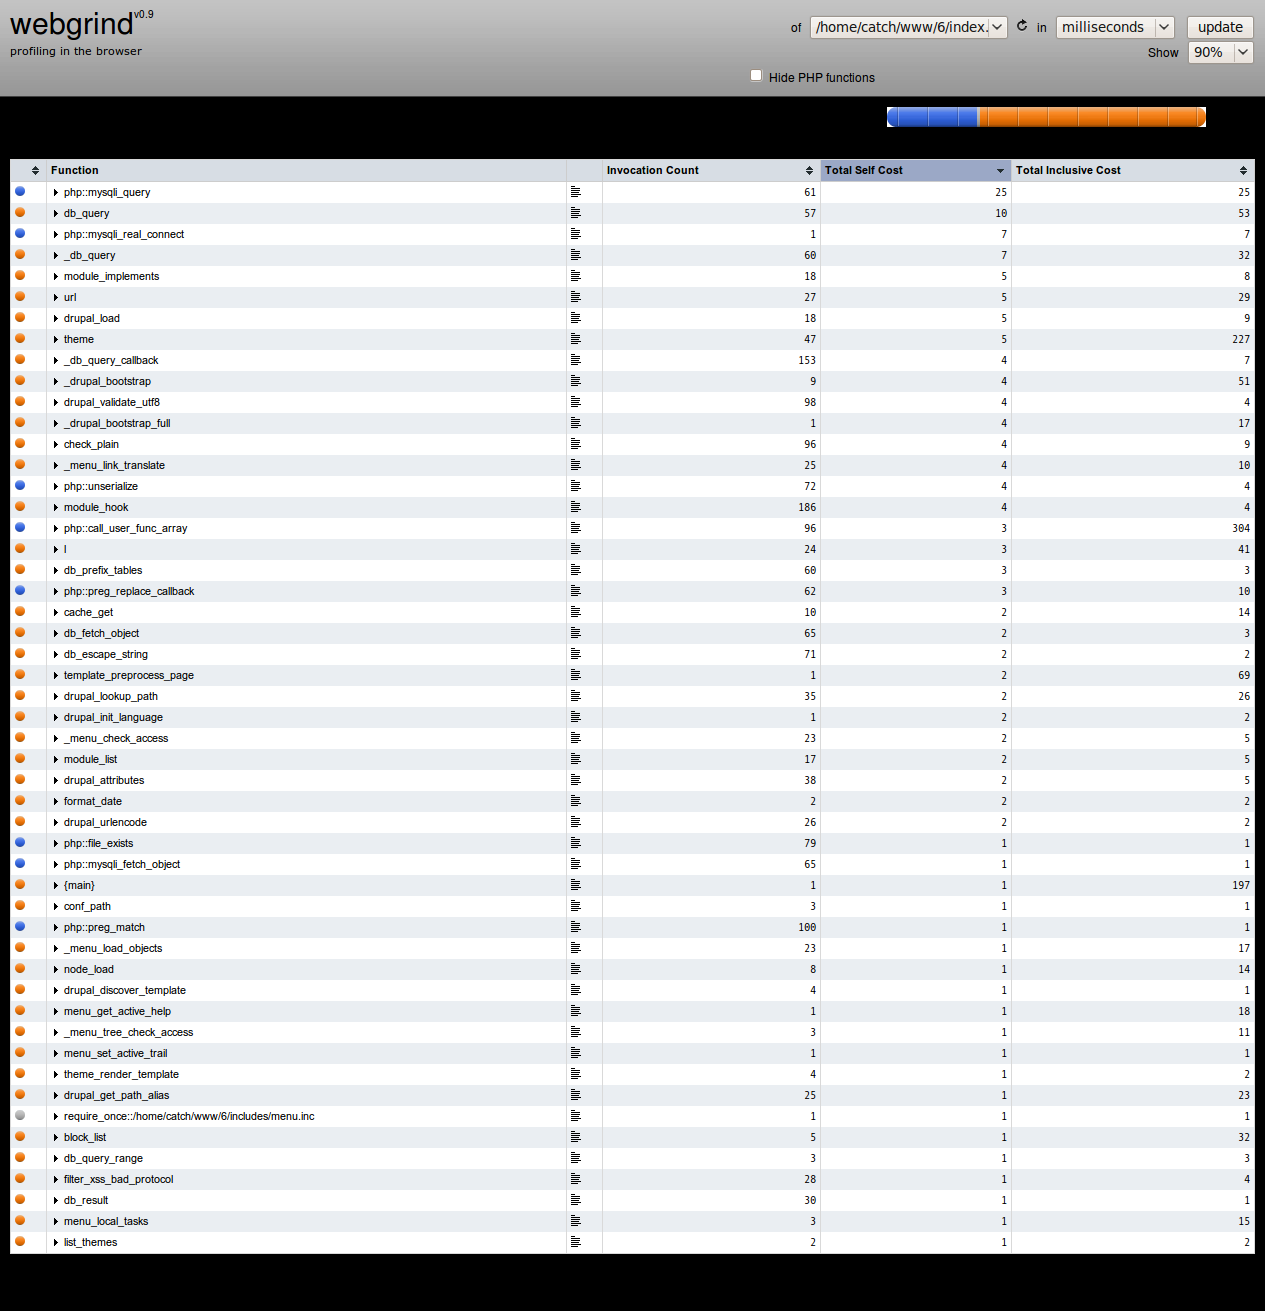
6: 412 different functions called in 197 milliseconds
I've attached the cachegrind files themselves too, so people can stick them in webgrind / kcachegrind themselves.
| Comment | File | Size | Author |
|---|---|---|---|
| #108 | drupal.myisam-hack.patch | 662 bytes | sun |
| #82 | xhprof_front_inclusive_walltime.png | 284.02 KB | jon nunan |
| #82 | xhprof_front_exclusive_walltime.png | 69.32 KB | jon nunan |
| #82 | xhprof_front_unserialize_drill.png | 24.79 KB | jon nunan |
| #67 | front.png | 255.82 KB | catch |

Comments
Comment #1
catchgrr, managed to get cache miss for schema in the 7 cachegrind. fresh screenshot and grind file attached.
Comment #2
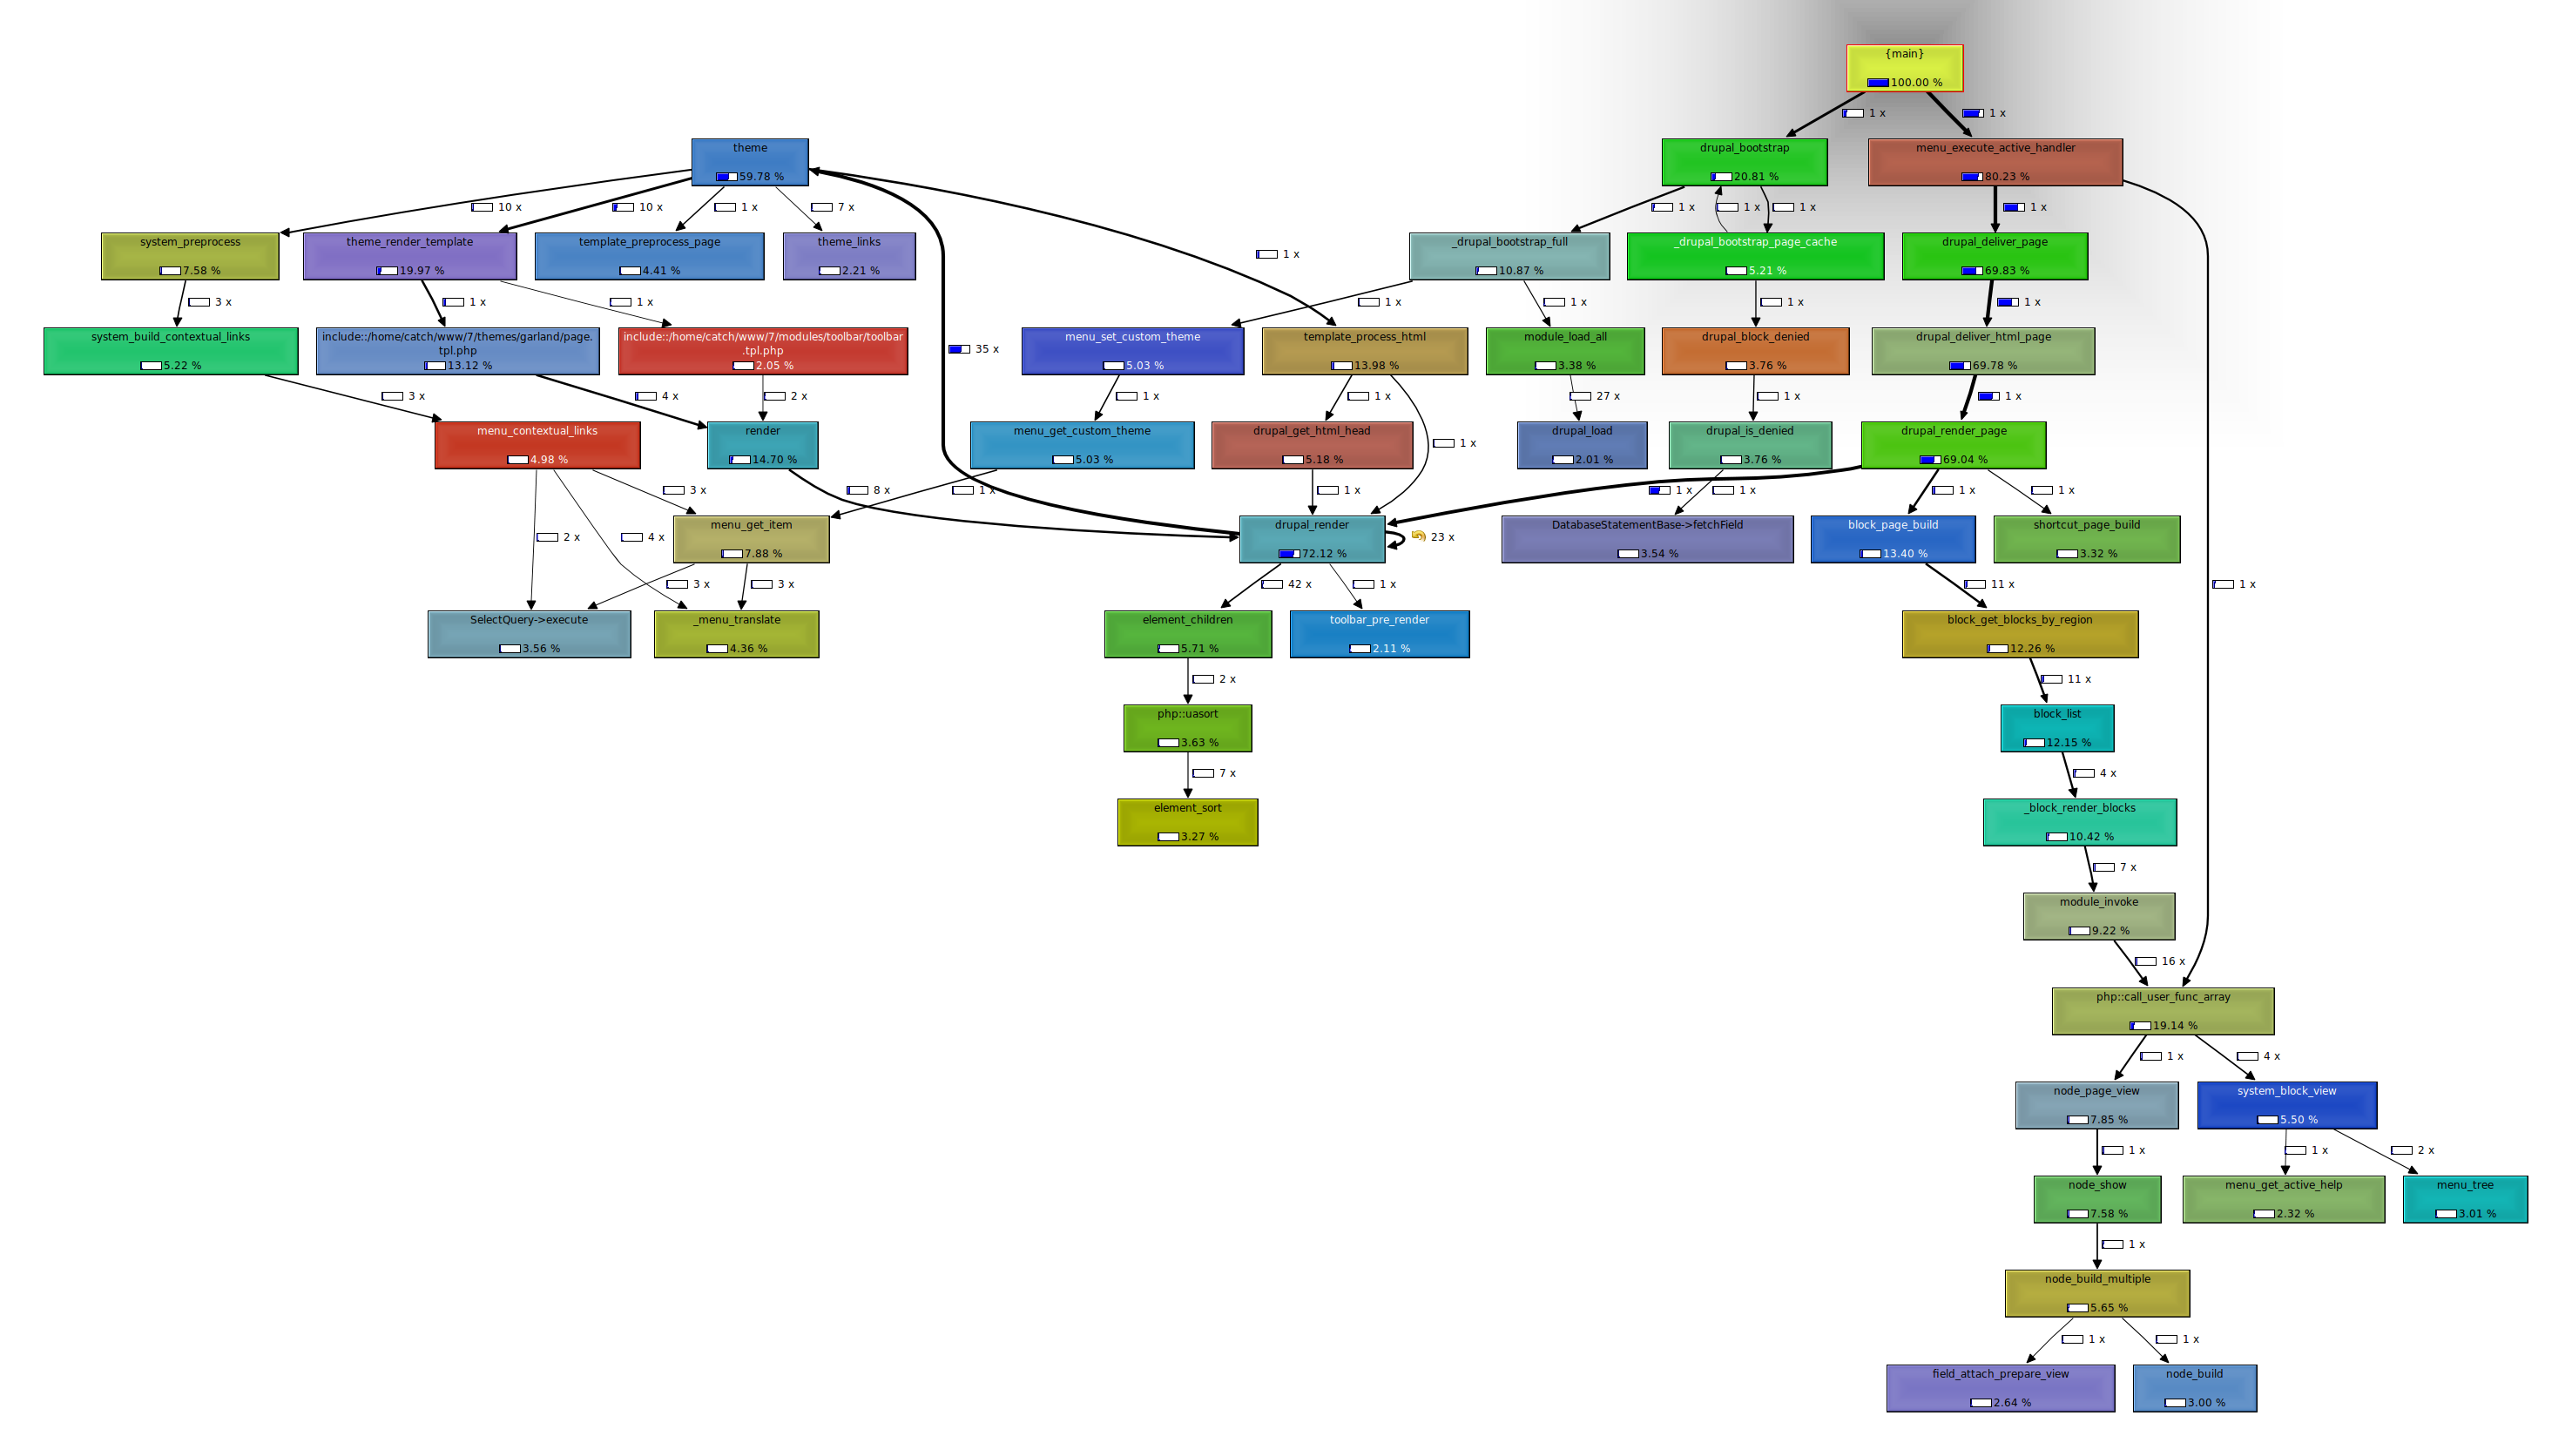
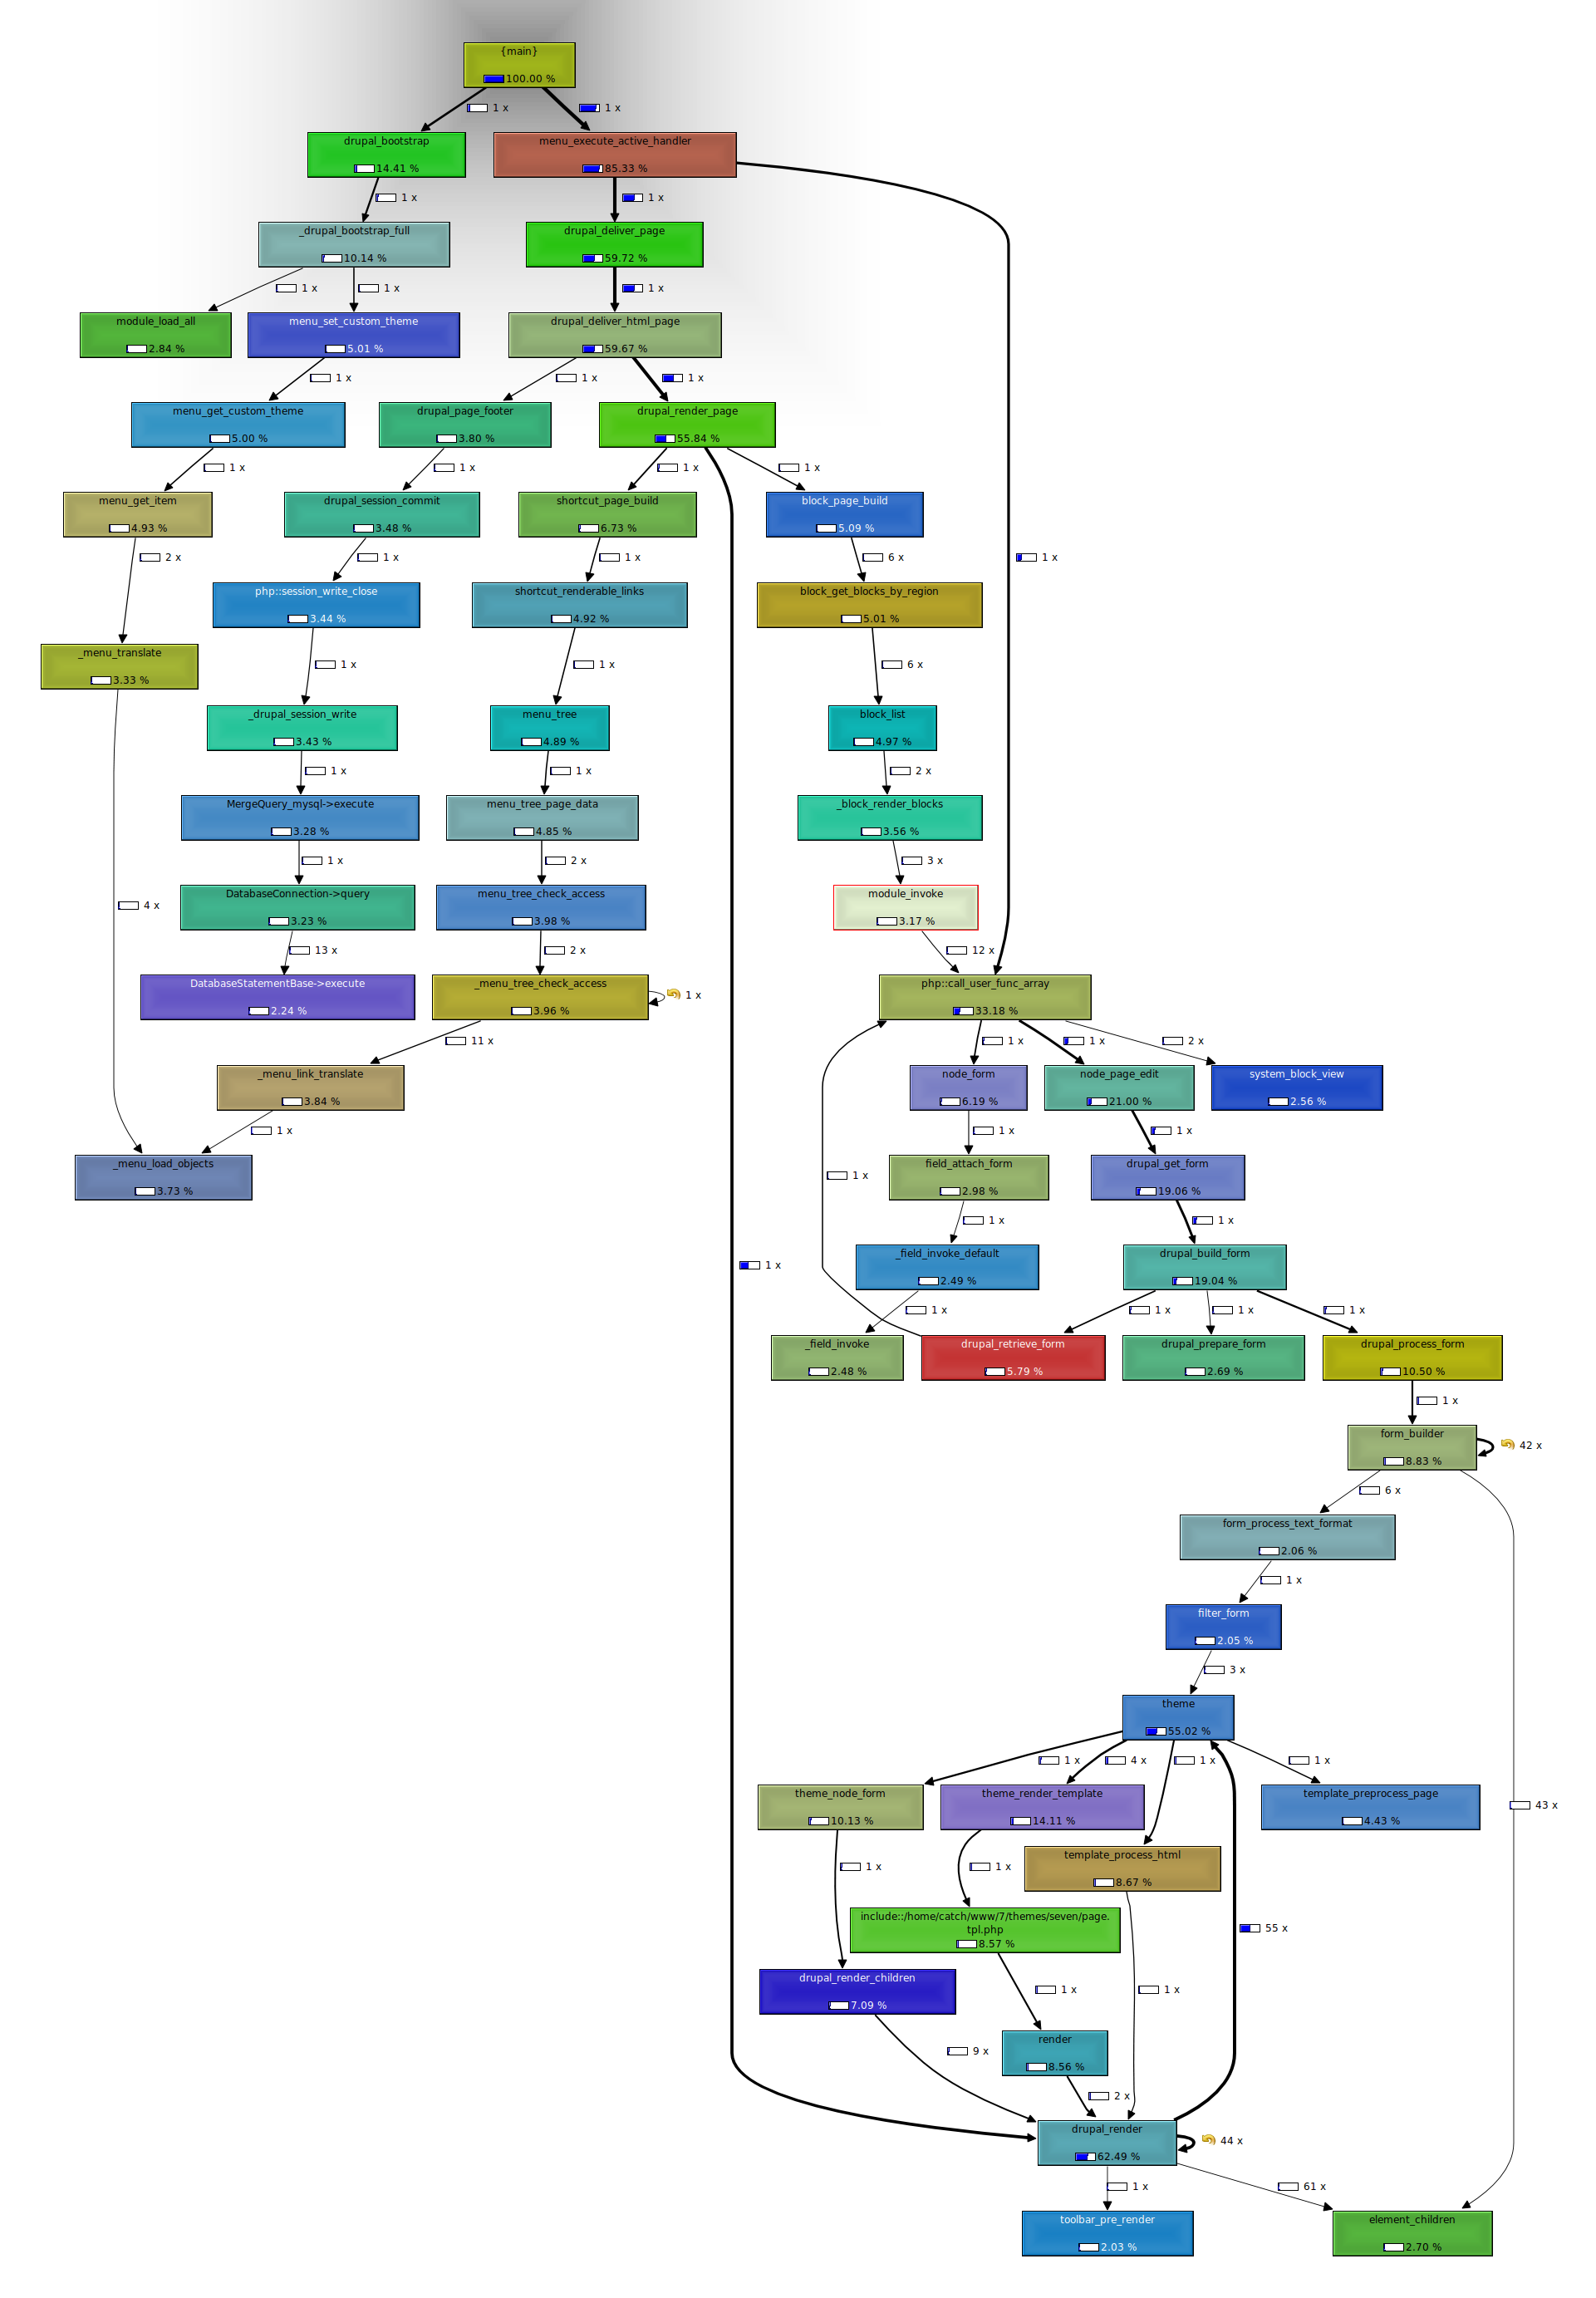
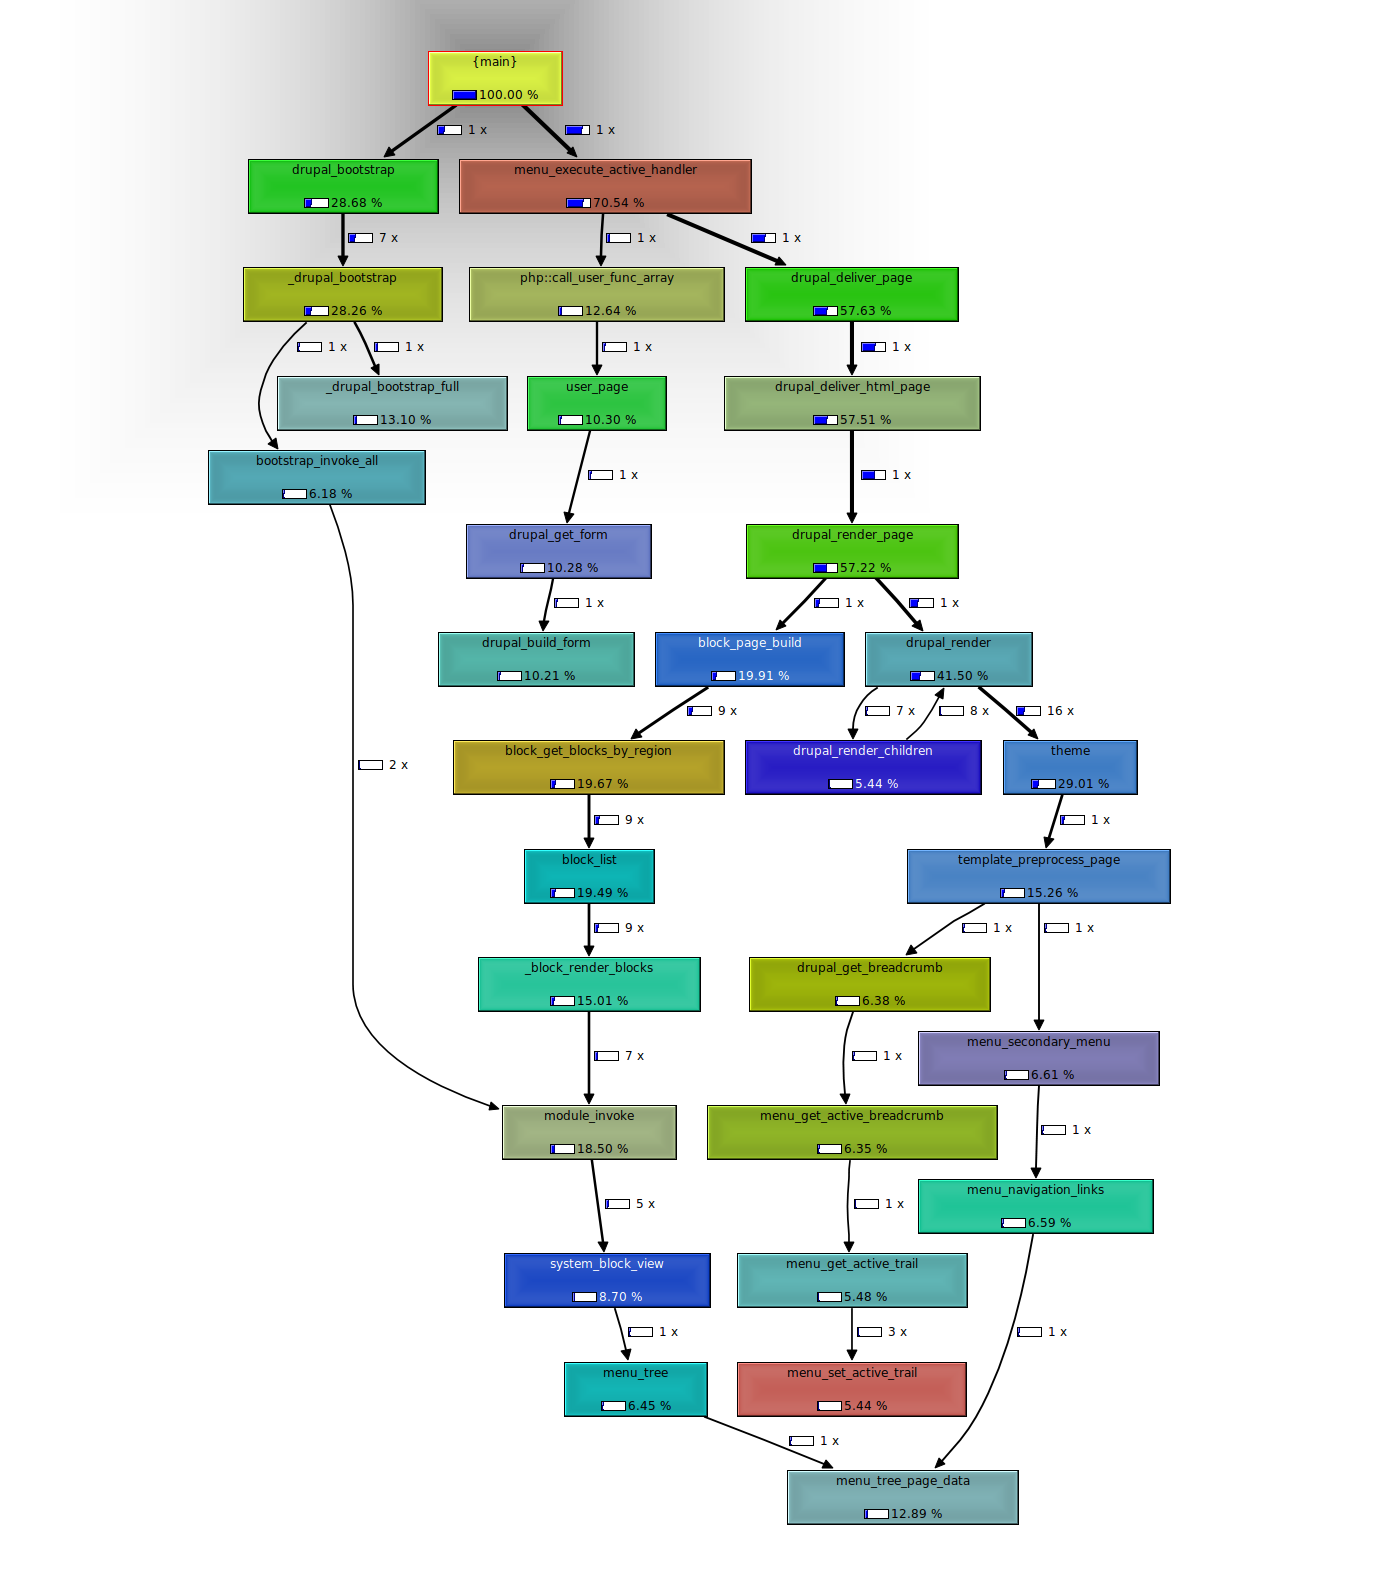
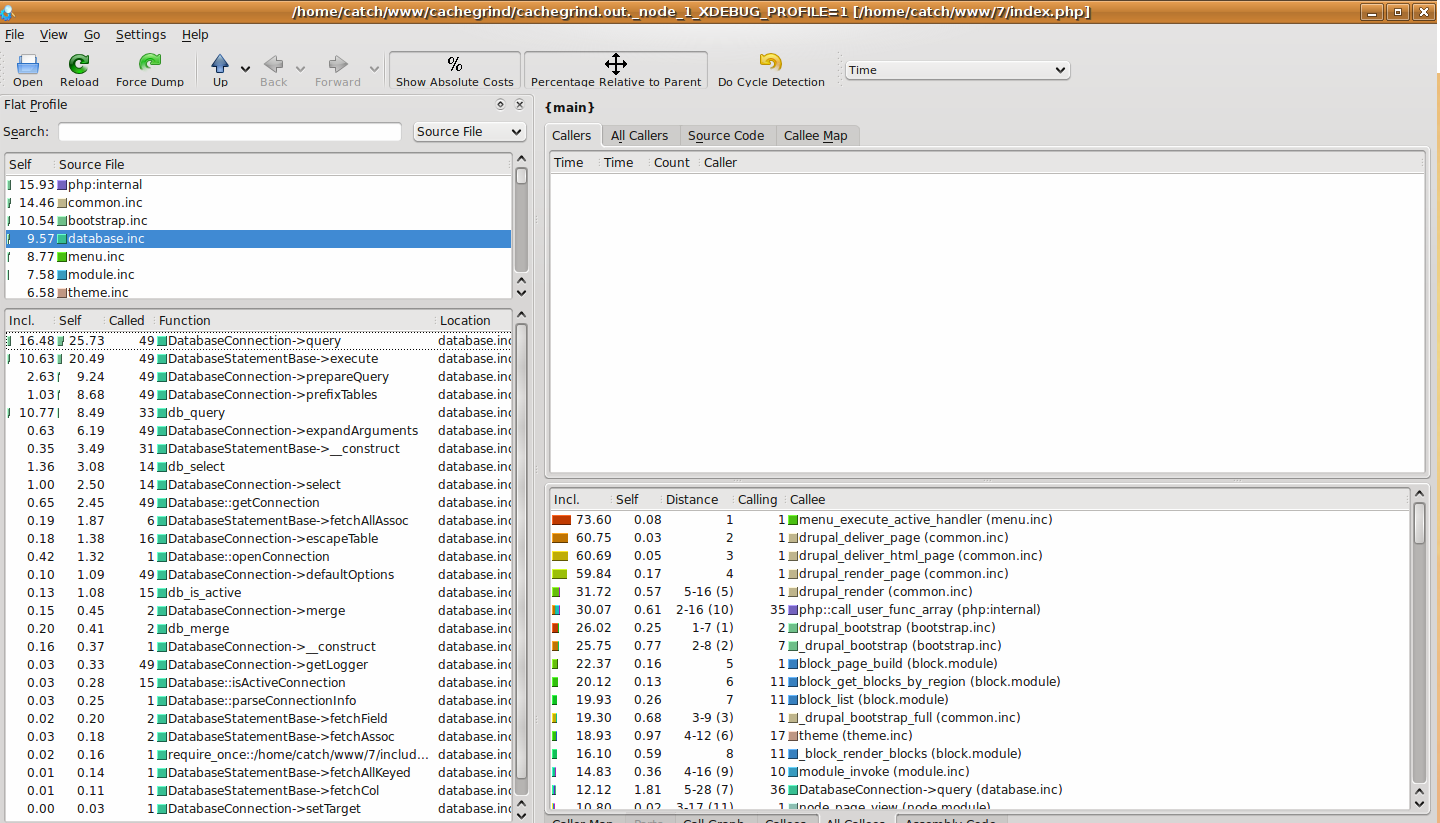
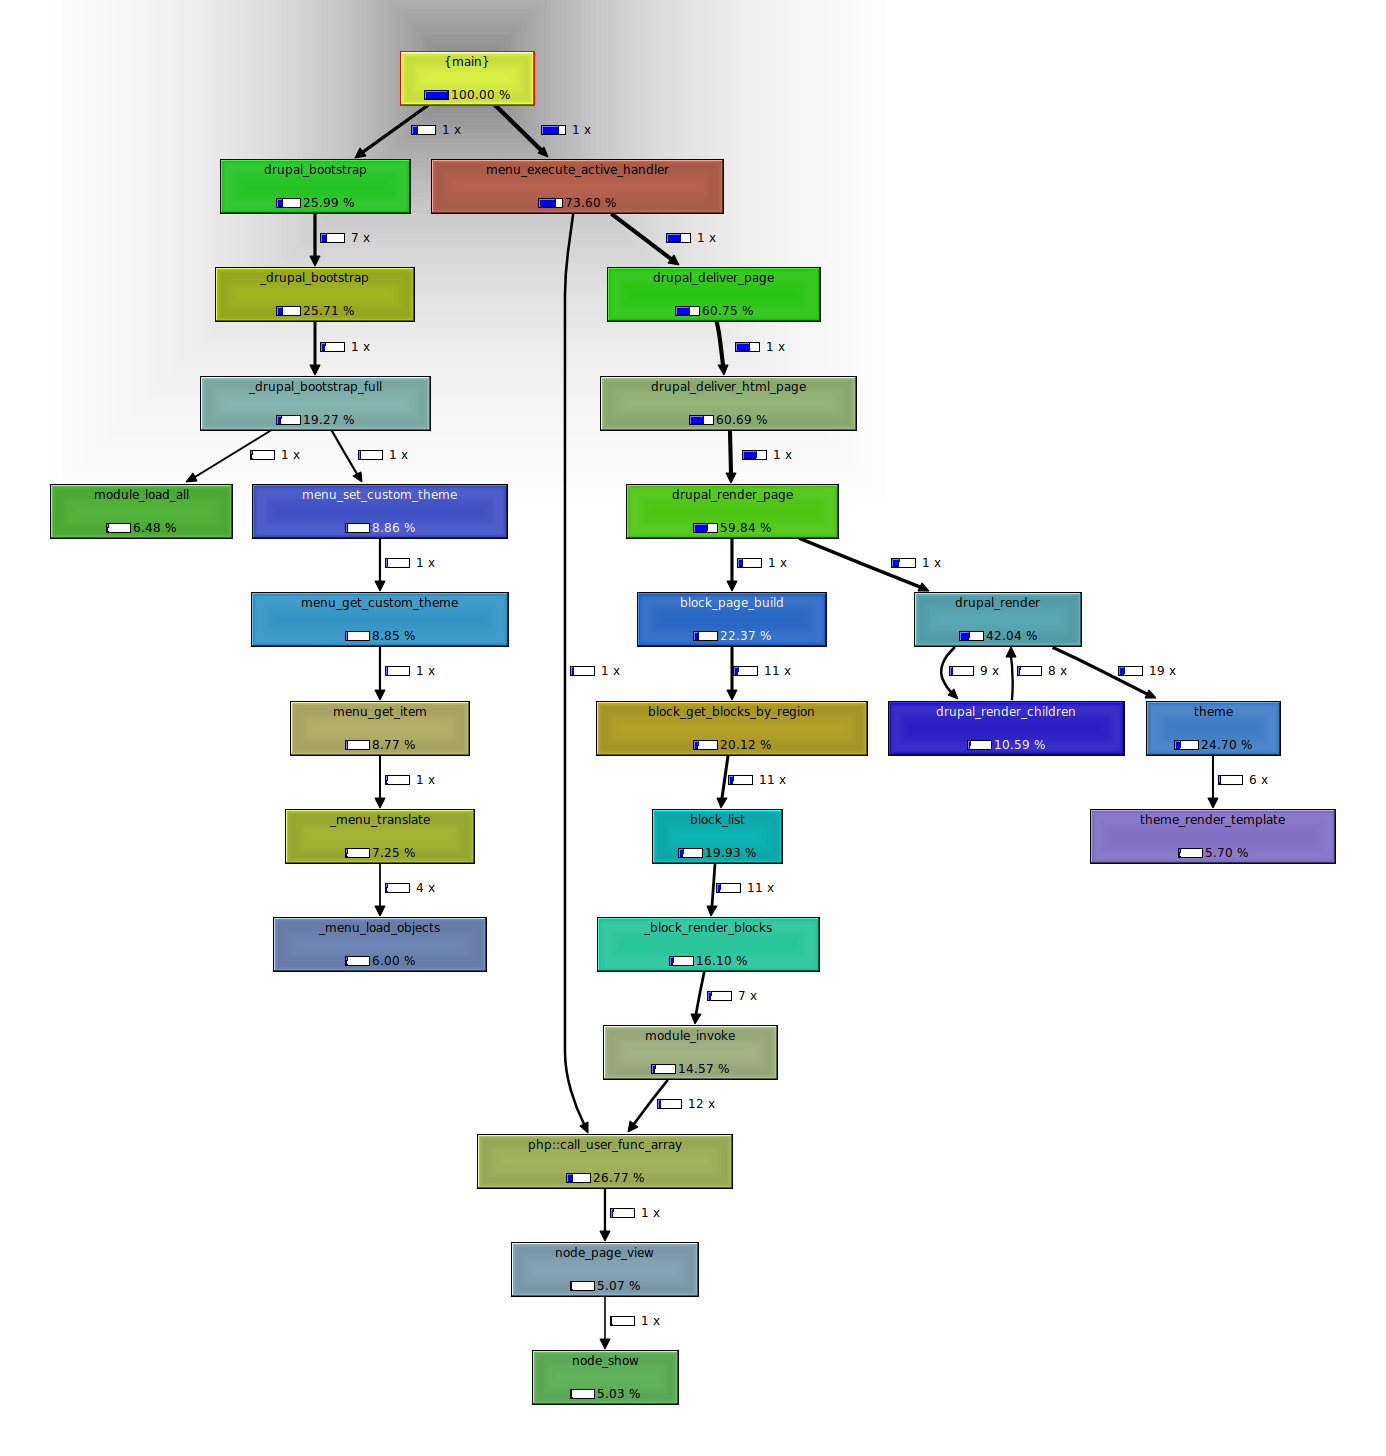
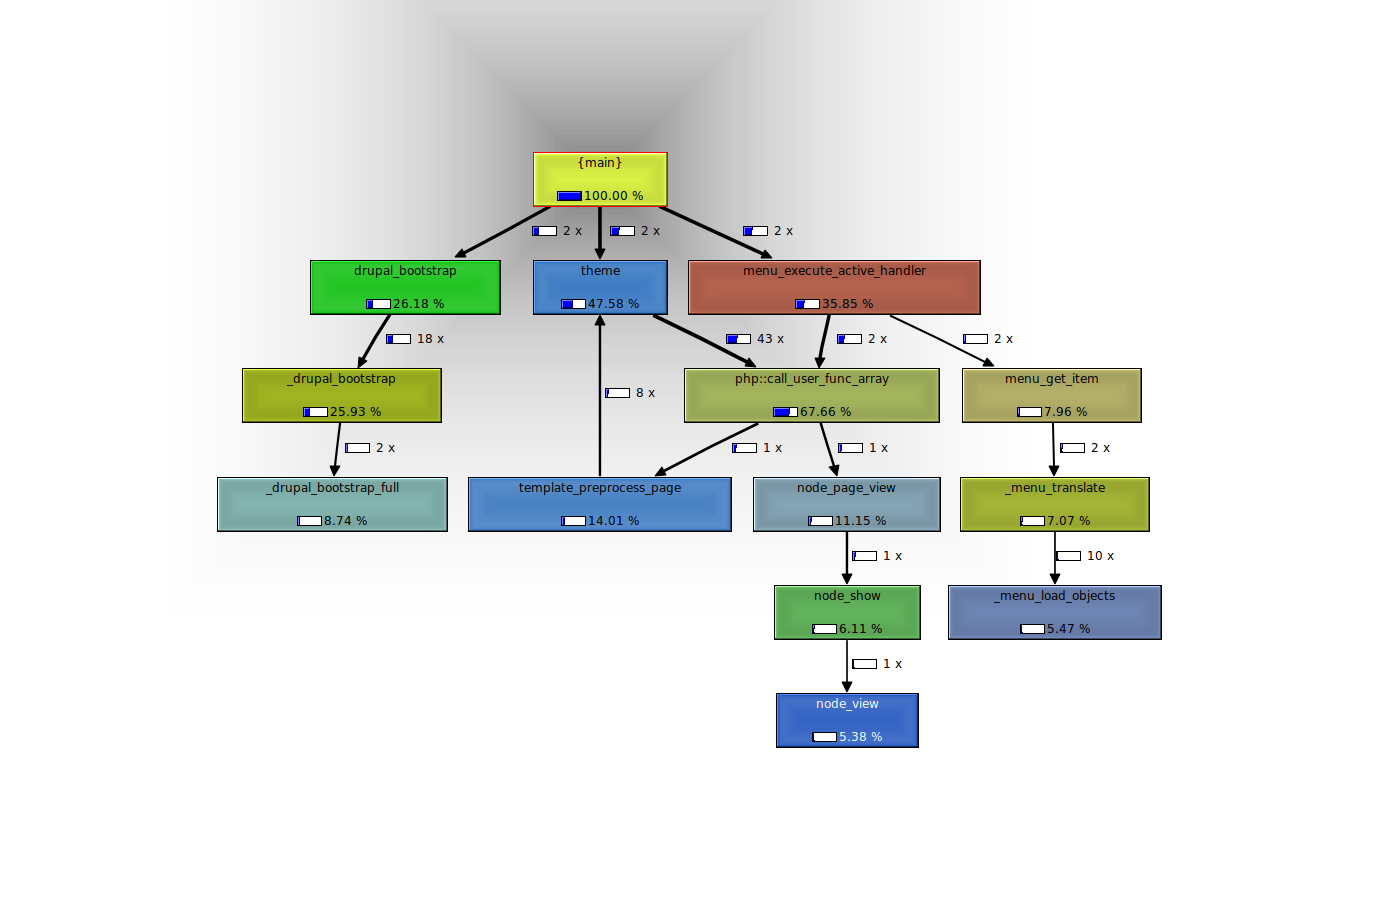
catchpretty callgraphs from index.php
Comment #3
catchSo looking at all this, all I can see is the same story I've been banging on about for months:
1. PDO is slow so we should reduce the number of database queries - not only to reduce strain on the database, but also PHP overhead building and executing the queries.
2. We have a long tail of function calls which take between 1-10ms each over what we used to have in D6, these add up to a much slower page request overall.
Comment #4
webchickHm. It seems to me that a lot of the fault lies with the render API, unless I'm misreading the graphs.
Comment #5
yched commentedWell, we put a whole lot more stuff behind drupal_render() in D7, so it's hard to compare.
Comment #6
catchYeah our entire block rendering process is within the page building now, the graphs really look like two different applications to me.
Either way I'm running out of ideas just staring at webgrind tables, so expect more pretty graphs soon :)
Comment #7
catch/me loves kcachegrind.
Comment #8
Anonymous (not verified) commentedSubscribe
Comment #9
Crell commentedcatch, I don't see any part of the DB system listed in the graphic flow. In fact the only part of PHP that is listed is call_user_func_array(), which we know is annoyingly slow.
That said, reducing DB queries is a good thing in general, no question.
Comment #10
catchCrell - that's because it's only a high level overview - we have enough indirection that producing a full callgraph would be pretty hard.
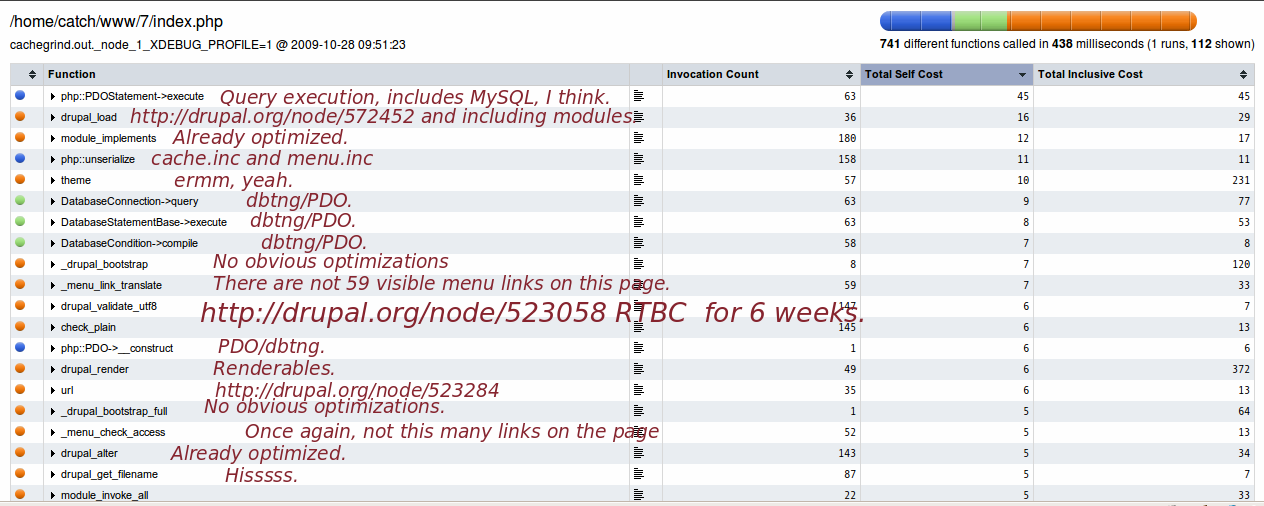
I annotated the top 22/23 expensive functions on node/1 in a new webgrind screenshot. However I really recommend anyone asking detailed questions on this thread to get kcachegrind or webgrind set up locally and poke around yourselves - I'd much rather spend 30 minutes in irc helping people get set up and interpret results than taking screenshots.
Just a note on this screenshot - while queries are only 10% of execution time in webgrind, that's likely due to the overhead of producing the callgrind itself - I visited the same example page with devel query logging on, and it said:
Which puts it at around 1/3rd.
Yet another important note on the screenshot - these are only the top 22 functions (for self time), between them they're less than 200ms, the total execution time was 438ms - meaning over 50% of time is spent in the long tail of function calls.
Comment #11
casey commentedLike yched said at #5 there's a whole lot more functionality in D7. For comparison-benchmarks with D7, D6 should at least include CCK (especially at node views).
Comment #12
sun1) First thing that looks a bit strange to me is the block of functions and % for block building.
2) Second, I'd like to see the innards of this still very big cufa() block. Hence, the attached patch. Please note that, again, only field API functions pass up to 7 arguments, and while this patch is primarily meant to see a bit more here, I really really wonder whether we shouldn't implement + restrict the number of arguments just like we did for drupal_alter() now. That could not only help in performance profiling, but is most likely also faster, and on top of that, it would introduce some more consistency.
Comment #13
sunsorry, did a silly mistake.
Comment #14
CorniI commented@#11: There's a principle, it says, you shouldn't pay for stuff you don't use...
@issue: There's (probably) no major performance sink hidden anywhere, so just extending code freeze for performance related stuff doesn't really work. This really would require more abstract design work than just throwing some static caches here and there in. But as long as the main focus is on features, with i think 3 exceptions or so to get more (really cool!) features in, this doesn't really work.
When you go to a higher level, this is kind of #smallcore, because some people don't care if they can store there fields contents (node bodys...) in a CDN or not, they just want to have their blog running, and if it runs slow, because the flexibility of the Field API _costs_ performance, even in this simple case, drupal sucks for them.
Not that Drupal getting slower with each major version would be new: #206570: GHOP #127: Benchmark 5.x vs. 6.x
Another approach would be to use code generation, simple text-copy inlining for often-used and smaller functions (say, check_plain), micro optimizations like TRUE=>true, there are quite some examples out their.
And i'm sure that the php performance of call_user_func_array() could be improved, if someone would step up and profile php and then submit a patch to PHP, the same goes for PDO, but PDO is (according to some posts on php-internals) pretty abandoned, so that's probably more complicated...
Comment #15
catch@Cornil - this has nothing to do with smallcore - you can't have nodes use field API or not use it for node body and also have a consistent API.
Both fields and the database layer are also subsystems where we trade some performance for (at least the potential of) greater scalability, let alone features - it makes sense to make that trade-off in some situations. i.e. with dbtng we have more or less eliminated LOWER() queries, and Crell just filed a bunch of patches for master-slave support.
The point of this thread and #513984: Find bottlenecks in HEAD - meta issue is to understand where those trade-offs are, what their impact is - something which is sadly very, very rarely done before patches get committed, and much harder to do afterwards (although we did do it for body as field). Then we can look at mitigating that impact, or trying to make gains elsewhere.
For example if PDO is adding a lot of overhead for each actual MySQL query - then it could make sense to try 1-1 exchanges for direct database queries which are in the critical path - obvious ones in HEAD would be places like module_list(), some filter queries which are shown on any page with a formatted textarea. These would be no-ops in HEAD, but allow any site with a pluggable caching backend to eliminate not only the cost of the database hit, but also the cost of PDO itself.
Additionally, Sun's patch is to look at what c_u_f_a() is hiding, not to try to factor it out (although we did successfully do that for drupal_alter() a few weeks ago). New pretty graph with that applied (and return array() at the top of menu_contextual_links()).
Comment #16
peterx commentedComparing D7 with D6+CCK will not work for sites that do not currently use CCK. They write their own modules and can optimise the performance of those modules or cost out the lack of performance. They need to know the cost of the bit they cannot optimise, core, and decide to upgrade hardware or donate time working on core performance or just leave the upgrade for a year.
Most of the systems I look at hit database performance issues before CPU. APC makes code load and execute cheap. Databases perform beautifully in test systems because the tables are cached in memory by the database. You then put the system into production and there is not enough memory to cache all the active data. The uncached database call is 100 times more expensive. Adding cache inside Drupal may not help because it pushes something else out of memory.
The best contribution I could make would be to look at a trace of all the SQL calls. Is anyone recording the SQL?
I am looking at the first use of D7 in a couple of weeks for projects starting early 2010. Is anyone looking at the SQL before then? Perhaps a child thread on SQL research and keep this thread for code research?
Comment #17
catchYour best bet for SQL calls is devel module - install HEAD, install devel HEAD, turn on query logging, generate some content.
In general that's improved over D6 - we added indexes where needed, and reduced a lot of overall hits to the database with node_load_multiple() (now entity loader), and a path alias whitelist and cache. There's two main areas still to look at - some of the queries which are still unindexed, mainly statistics, forum etc. and more aggressively removing queries which are made on every page / most pages.
Comment #18
catchIn response to Dries on twitter:
http://twitter.com/Dries/status/5342711918
edit: on irc, it was pointed out that the parameters of this test weren't completely clear from the comment.
What I did, was a completely clean install of each version, no CCK - just to test the cost of baseline bootstrapping and page rendering. This shows that this baseline is currently twice as expensive in Drupal 7, as Drupal 6 - I think this is in large part down to some horrible bugs introduced by d7ux patches like dashboard and shortcuts.
I will also try to run these again with no optional modules enabled, and with CCK installed, to give D7 a bit more of a fair run. But the idea that the only difference between D7 and D6 is that 6 doesn't have CCK installed is patently false, as you can see extremely clearly from the cachegrinds attached.
/endedit
I installed Drupal 6 and Drupal 7 - but without any generated content at all, then hit the front page with ab -c1 -n1000
D6:
D7:
Comment #19
catchDisabled all optional modules in D7 (includes shortcuts, toolbar, dashboard - some of which have outstanding critical performance issues)
Not a great deal of change - especially compared to 20 reqs/second
Comment #20
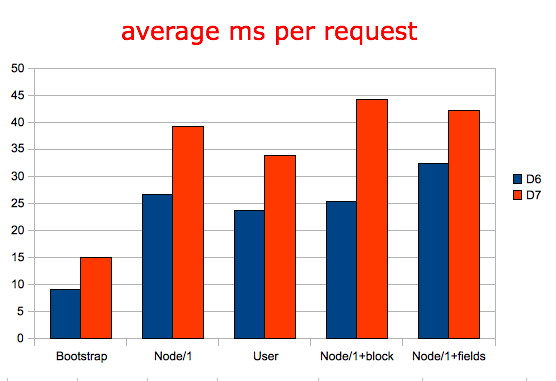
catchCCK vs. Fields benchmark, which is probably more what Dries wanted to see.
I took the following steps:
In D6, enabled CCK and text modules, removed the 'body' field from 'story', added a CCK text field_body to replace it, posted a node with just a title and a body.
In D7, all core optional modules still disabled (including some which are enabled on the D6 install), I just posted an article with a title and a body.
Then I ran ab -c1 -n1000 http://example.com/node/1 on each install.
D6:
HEAD:
Comment #21
nicholasthompsonWhat is the result of Devel's debugging on those pages (num queries, query time, PHP exec time, Mem use, etc)?
Comment #22
catchThis is the node/1 page CCK single text field, xdebug disabled, APC on:
D6:
Executed 34 queries in 18.99 milliseconds. Queries taking longer than 5 ms and queries executed more than once, are highlighted. Page execution time was 60.69 ms.
HEAD:
Executed 49 queries in 43.78 milliseconds. Queries taking longer than 5 ms and queries executed more than once, are highlighted. Page execution time was 123.79 ms.
HEAD with contextual links disabled:
Executed 36 queries in 27.24 milliseconds. Queries taking longer than 5 ms and queries executed more than once, are highlighted. Page execution time was 89.86 ms.
However I get deviation of well over 30ms for each of these - just picked what looked to be the median of 10 or so requests each.
Comment #23
simeDo we need to look past bootstrap? I get significantly different results for D6 and D7 when i exit before the active handler. (Attached the full results).
D6
D7
Comment #24
simeI suppose it's only 5 ms, only a part of the full page difference.
Comment #25
simeA further comparison of D6/D7 with some simple modifications. To start with I:
-- disabled d7 contextual links
-- uninstalled every module possible
-- disabled all blocks in D6.
Then I did the following comparisons. The following categories correspond to the graph and the attached benchmark data. I've also attached the spreadsheet summary.
Comment #26
simeNext I reverted to the basic setup (no blocks, no optional modules) and I installed devel. Refreshing about 10 times in each site, there was no meaningful difference between the time spent in database queries.
Comment #27
sunNice work, sime!
I'd especially be interested in call graphs for the /user page (ideally with that cufa() patch, too). There, we have blocks + a "basic" renderable array (a form) in the main system block. Hence, comparing /user to /user should be the most comparable page in the system. I'd even say that we should use it as primary target for performance benchmarking, analysis, and patches.
Please also note that we should get #607244: Decrease performance impact of contextual links committed ASAP.
Comment #28
int commentedSubscribe
Comment #29
moshe weitzman commentedI'd like to see some data with opcode cache. Time spent parsing php is usually substantial. We can dig up some old patches if that turns out to be a significant contributor.
Comment #30
catch@moshe - all my benchmarks are done with APC enabled. Or do you mean without?
Comment #31
sime@moshe, yes I should have said that my data is running on MAMP with APC.
Comment #32
int commentedI think that it would be beneficial if in testing results we see the last core time execution and with the patch time execution.
Like this:
Testbed results
fix_performance_2.patch passed (15s less) Passed: 14630 passes, 0 fails, 0 exceptions Detailed results
15 secounds less time testing that without this patch. or more: (1:13s more)
Isn't one exhaustive benchmark, but I think that is useful.
Comment #33
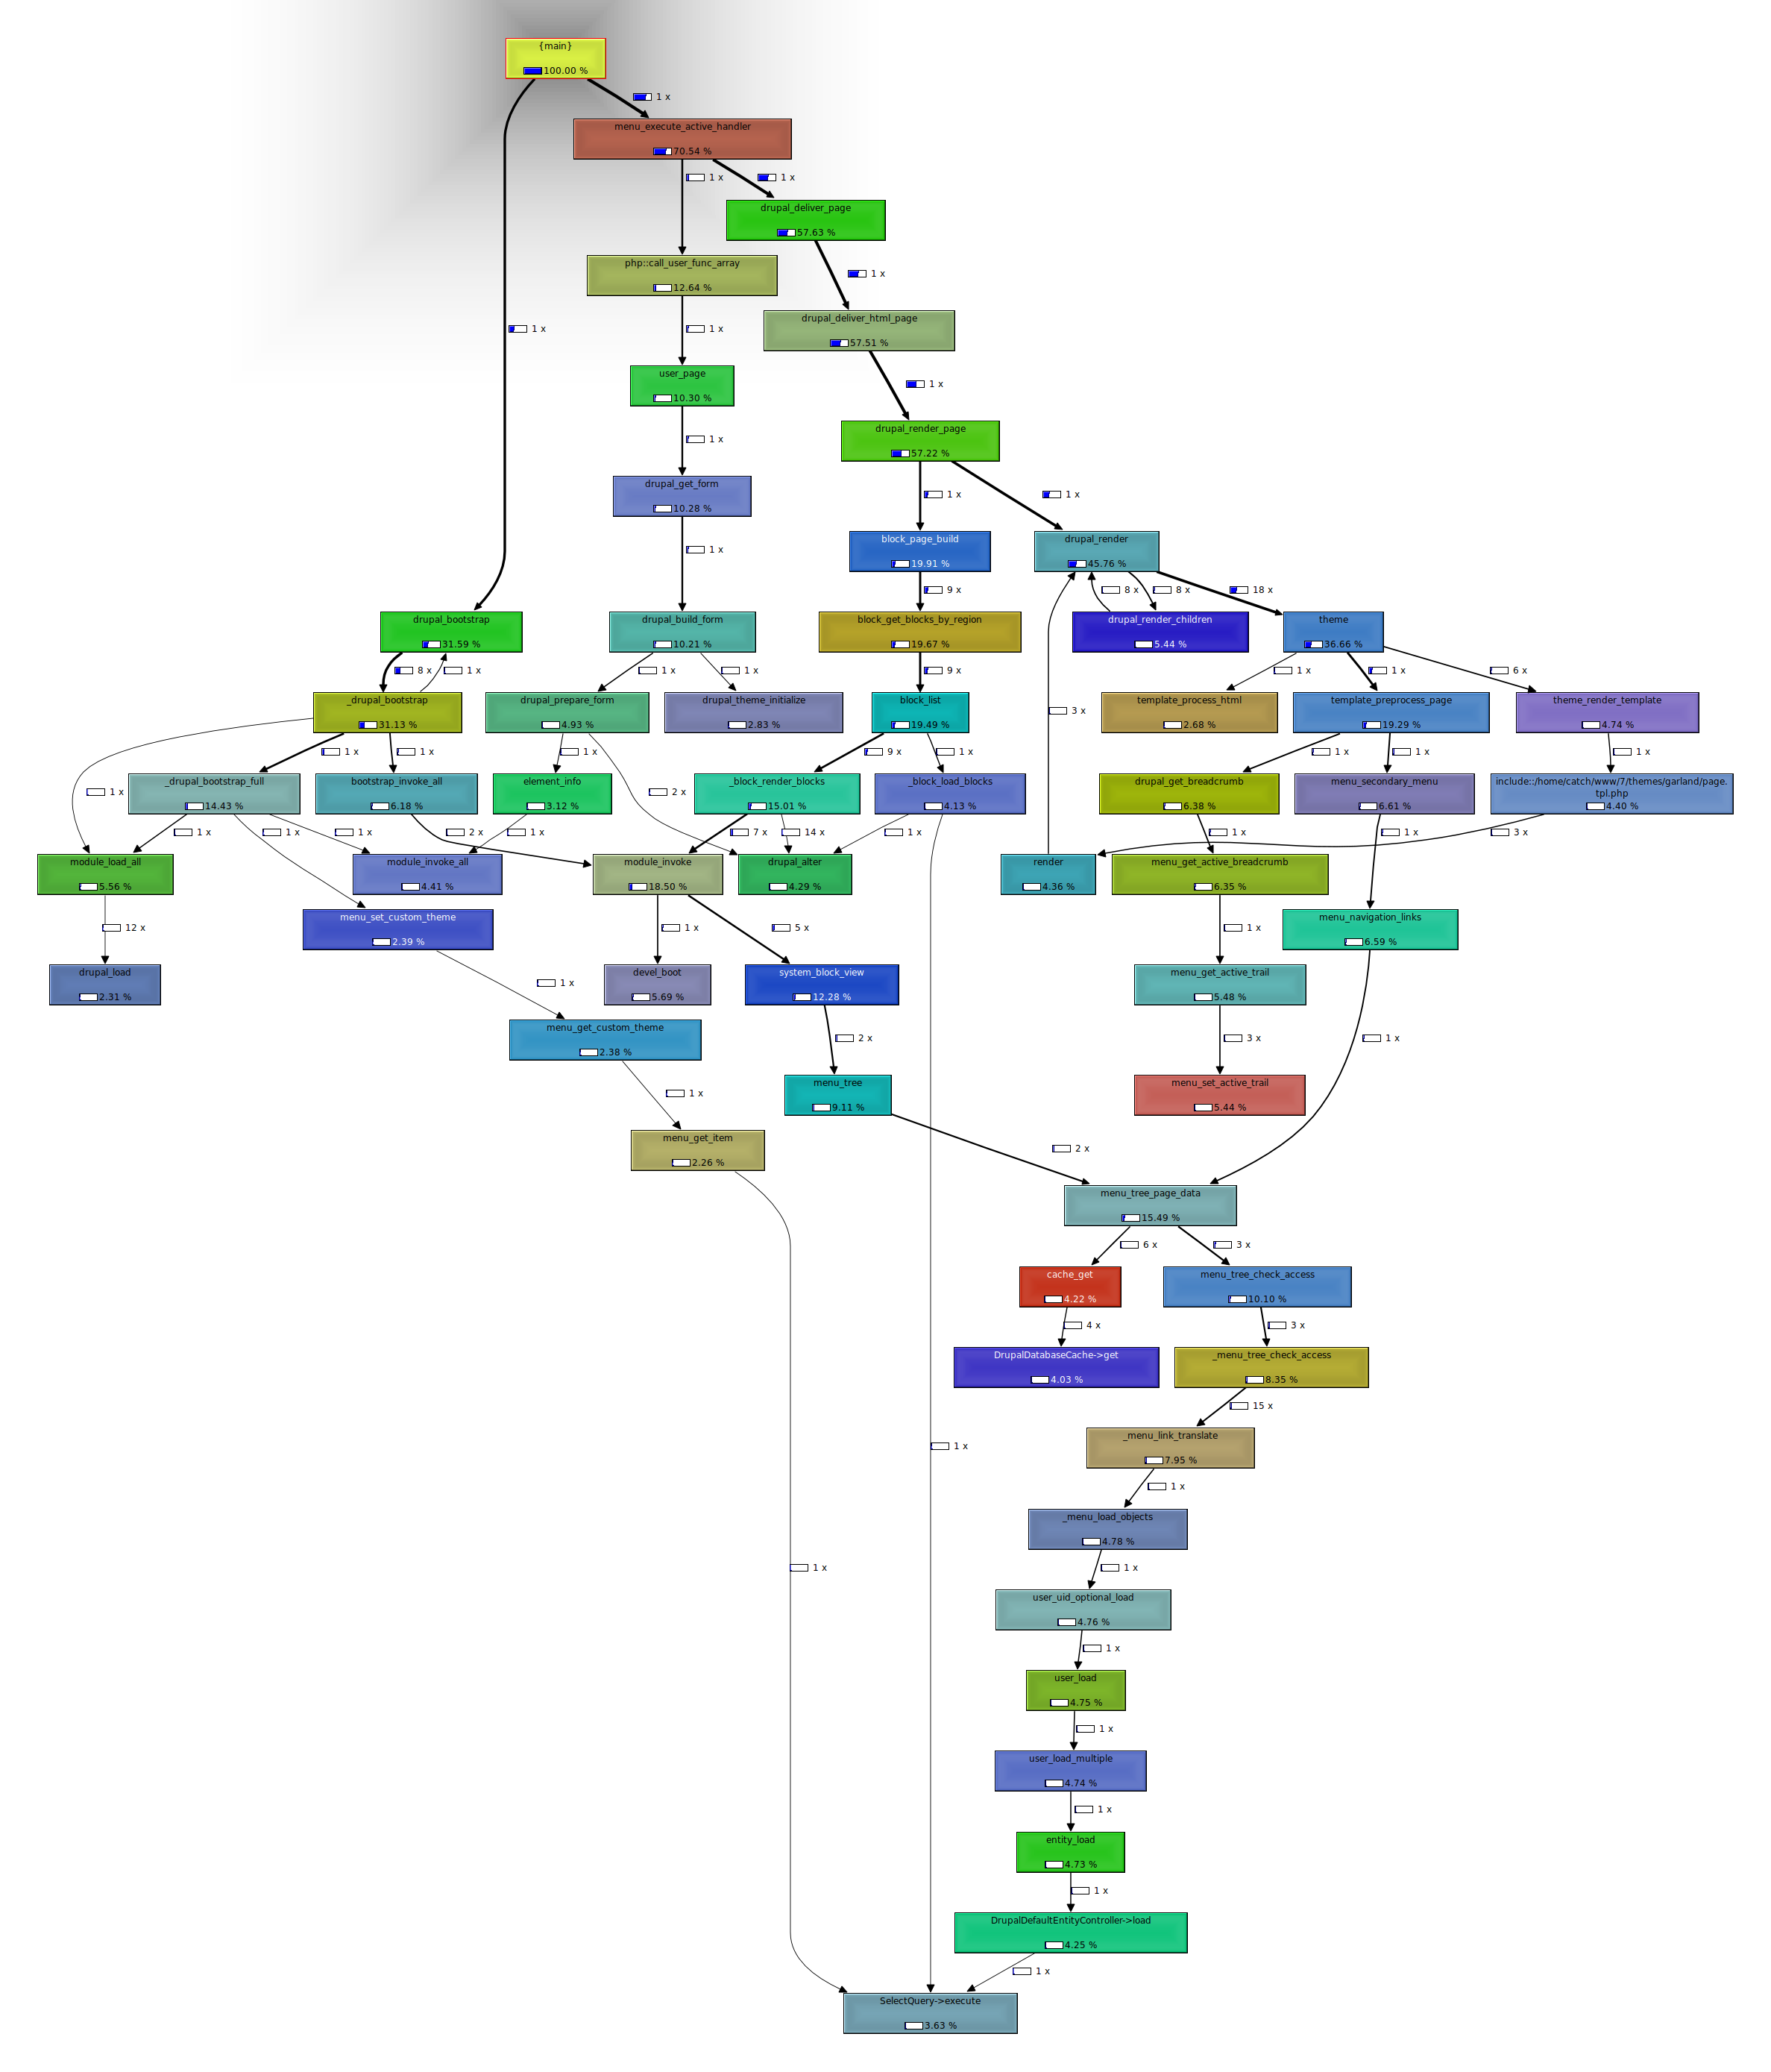
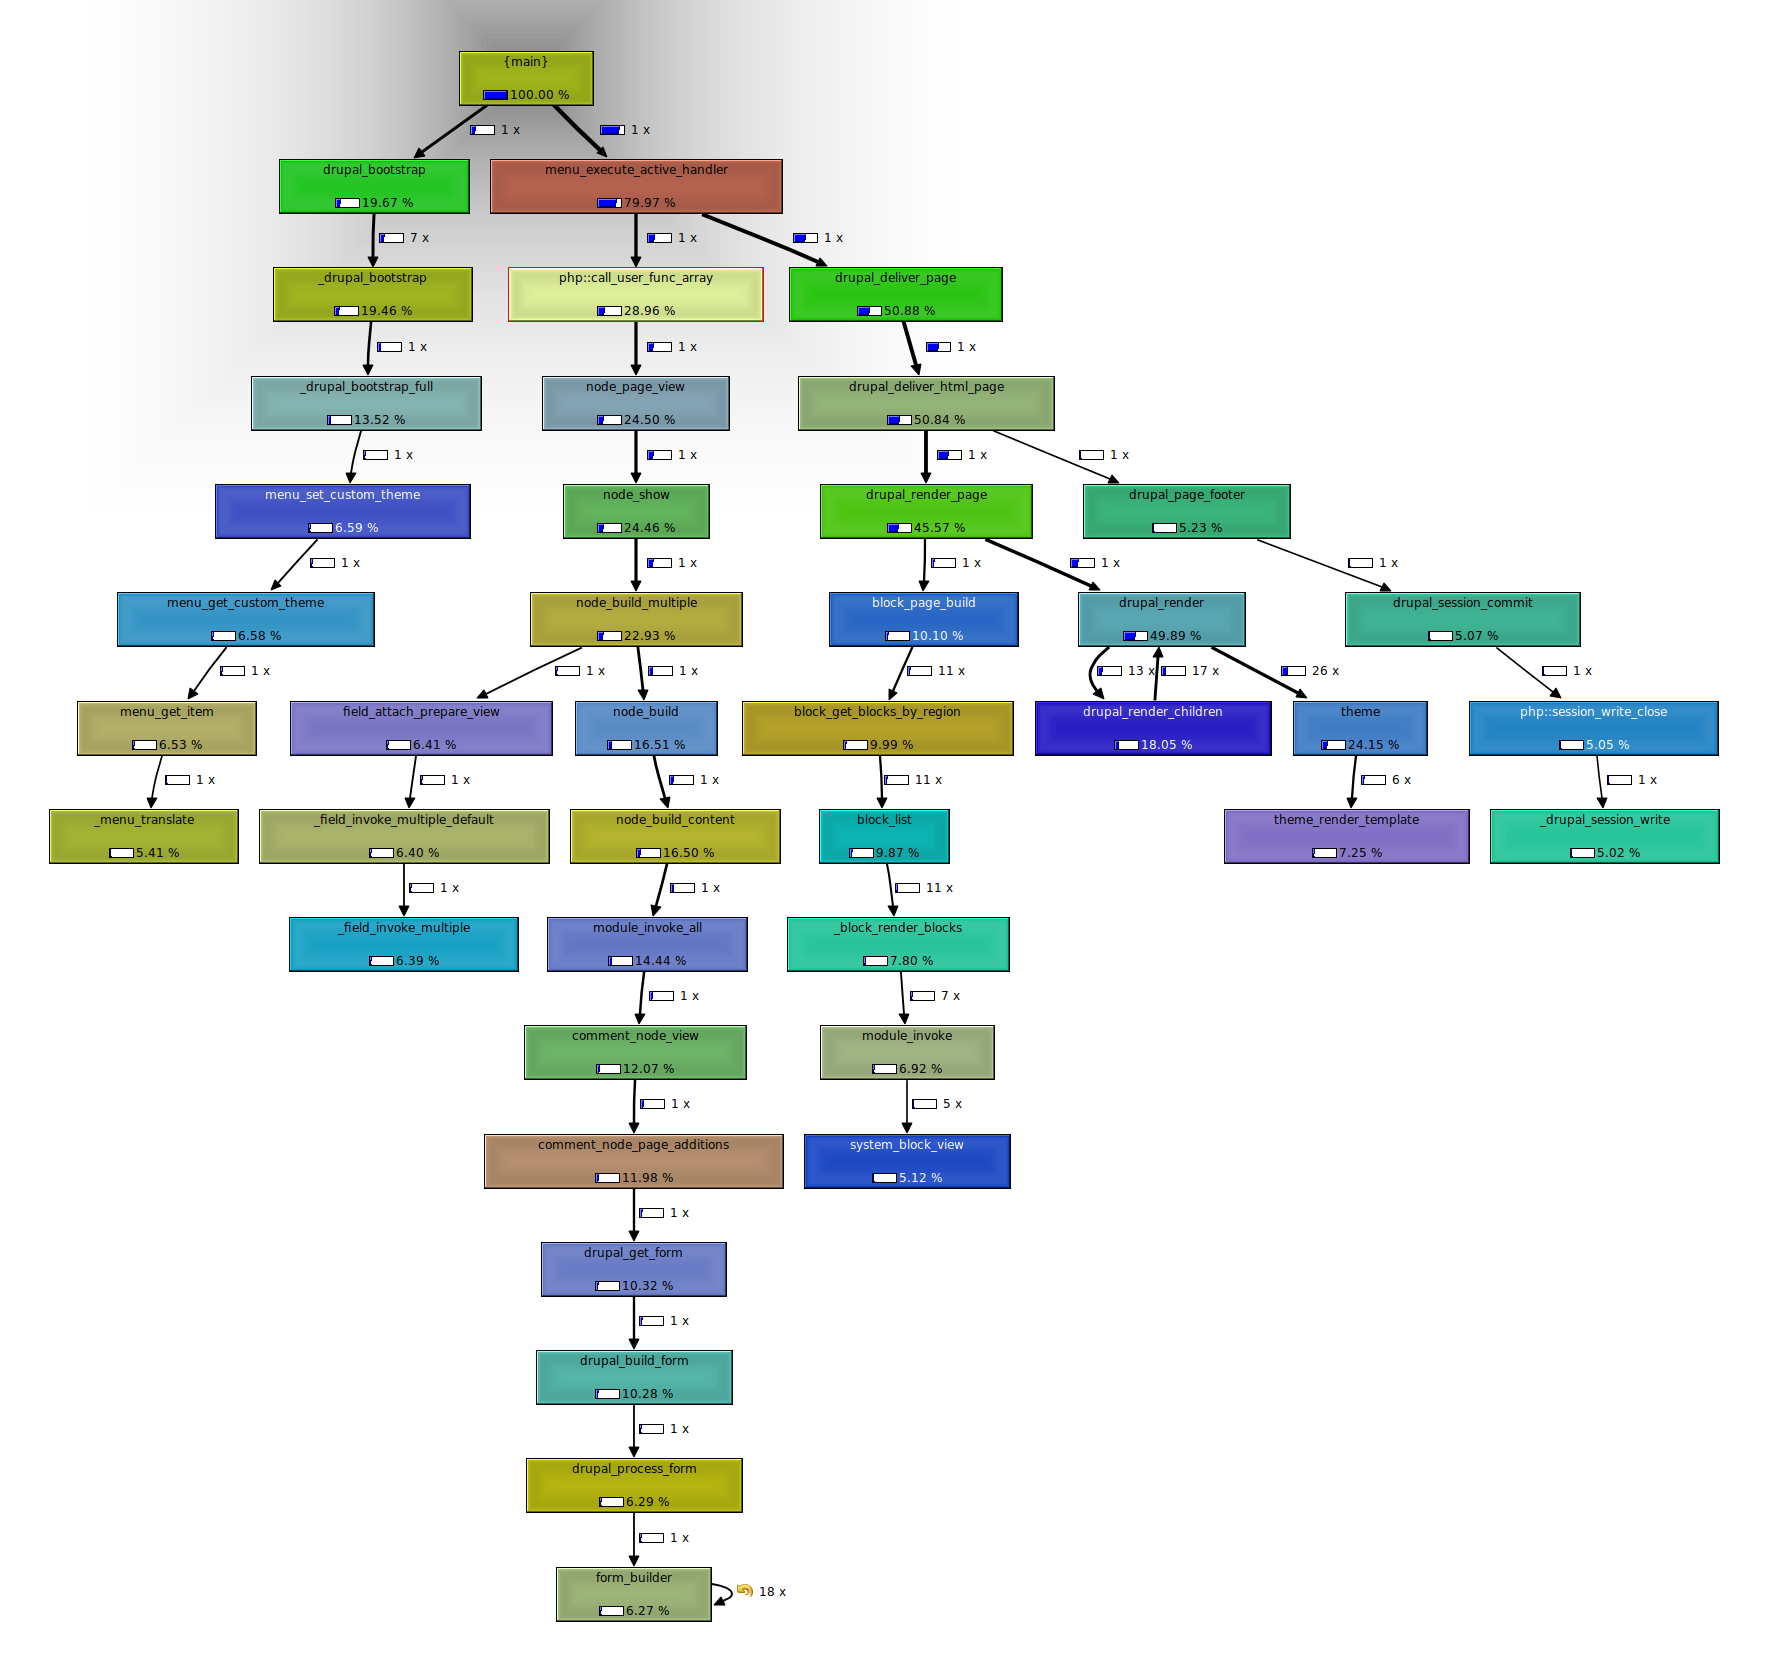
catchUser callgrind. All modules except for block disabled.
Comment #34
catchFound the graph settings, here's a more detailed graph :p
Comment #35
effulgentsia commentedsubscribing
Comment #36
scroogie commentedVery interesting. Subscribing.
Comment #37
Crell commentedWe should also see about a temporary patch to split up _drupal_bootstrap() so that we can see which parts of bootstrap are more expensive. Right now with the switch statement we can't tell if one part is considerably more expensive than another.
Comment #38
sunNice idea, Crell.
That, we could even consider to not do temporarily, because we're apparently calling a couple of functions that are plain indirection there. For that sake, I want to know what the bot thinks about the patch this time. ;)
Comment #39
moshe weitzman commentedA permanent patch. Once we are afraid to make a function call, we are lost. This adds less than 10 calls per request. Temprary patches would be more appropriate for highly hit functions like drupal_render(), theme(), check_Plain(), url()
Comment #40
webchickMarking needs review so that the bot can have a crack.
Comment #41
Crell commentedsun, can you roll a version with just the bootstrap changes and not the cufa() change? Sounds like that could be a for-reals patch.
Comment #42
sunIf we really want to do that, then we should open a separate issue for it, because there are a couple of things that would need to be fleshed out properly. This issue should solely focus on meta discussion, finding the causes for the slowdown, and comparing apples with apples properly. We already made good progress on that, and we should continue to do so.
Comment #43
chx commentedsun, if we want to compare apples to apples then we indeed need a temporary patch that separates out the bootstrap stages so we can find out wth is so slow. From looking at sime's graph I am eyeing PDO and I am not happy.
Comment #44
catchYeah the bootstrap change sounds great, but let's do that in a separate issue.
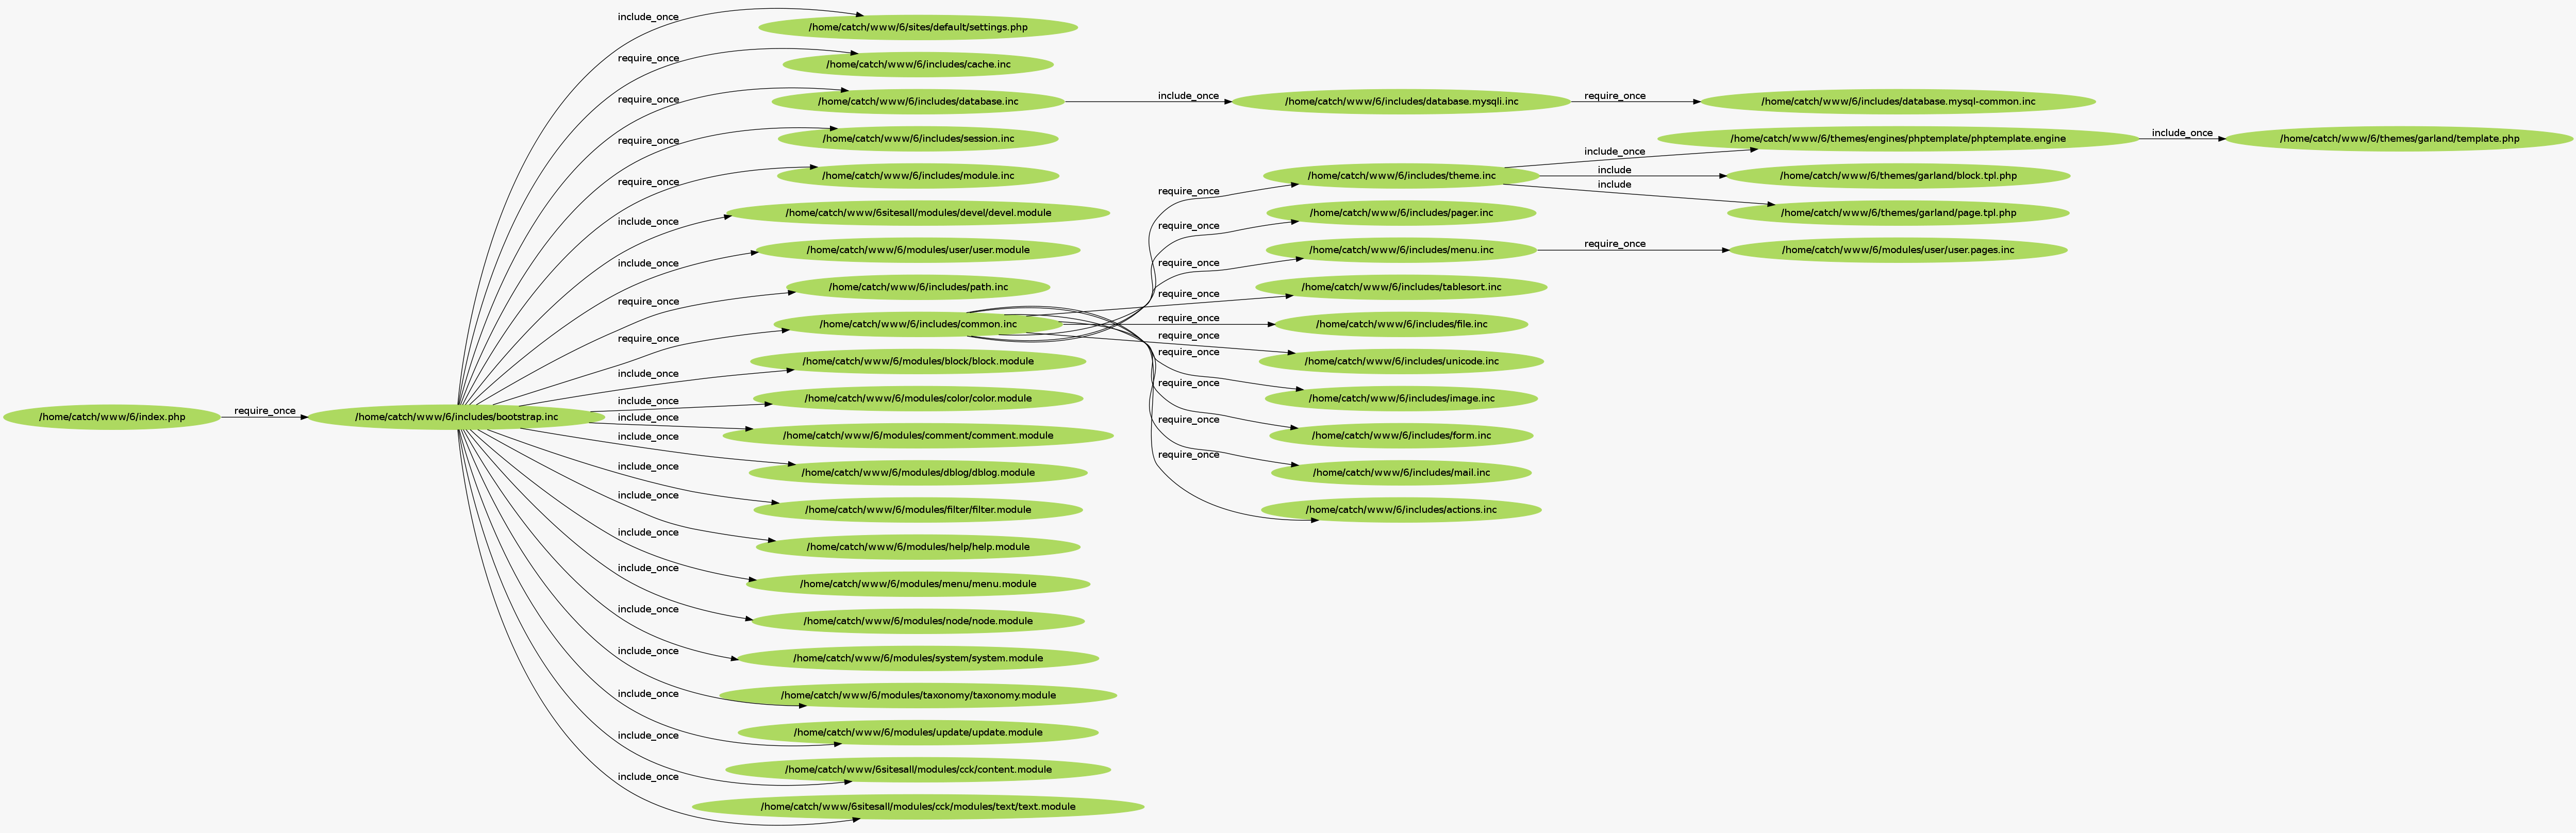
While we're on D6 vs. D7 comparisons, here's inclued output for the /user page as anonymous.
The actual structure looks fine, but in terms of actual quantity of included files things have gone up a fair bit.
Hat tip to: http://talks.php.net/show/drupal08/14 http://pecl.php.net/package/inclued and http://www.chehodgins.com/php/sorting-out-your-php-includes-using-inclued/
Comment #45
simeThe other day I was timing each
require_once ...in_drupal_bootstrap_full(). I was surprised that pager.inc took significantly longer to "include" than menu.inc, even though menu.inc has much more code.I found that the bottleneck in pager.inc was in the class extension at the top of pager.inc (
class PagerDefault extends SelectQueryExtender { ... }). If I take the class out completely, the include time for the file is again reduced.I just thought it was interesting. I plan to look further, but I have very bad profiling skills.
Comment #46
sun#622048: Streamline drupal_bootstrap() and expose the flow to code profilers
Comment #47
sun@sime: Interestingly, in #97293: Tablesort cleanup I already found out that we could include pager.inc + tablesort.inc entirely conditionally via autoloading. Due to the new query extenders, those functions are only ever used and required when a select query is extended. The patch removes the permanent loading of tablesort.inc on all pages, which completely works fine (except that totally wonky modules like forum.module may need to load it on their own, because it's doing totally wonky stuff in at rendering time, using cached query results). That, however, I'd call an edge-case, and I think that modules like that can happily load the code on their own.
Comment #48
Crell commentedIncluding a class shouldn't be any more expensive than the equivalent amount of functions, except that it may trigger an autoload. Then we have an extra SQL query in the autoload plus whatever other file needs to be loaded (select.inc). I suspect that's what is making it take longer.
As sun said in #47, we can probably remove most if not all explicit includes of those files and let autoload handle it. That way, pager.inc won't be loaded until after select.inc has already been loaded (because you need the select query before you can extend()), so that should even out the numbers. It probably won't change the amount of time taken, though, unless we can optimize autoload some more, which is on my todo list. I need to dig into that this week. Blargh.
Comment #49
peterx commented#48 If all the code to autoload was in /includes/, your autoload would not need a database lookup to auto include. Drupal core would lose a bit of structure. No other disadvantage.
Comment #50
Crell commented@peterx: I do not even understand what you're saying. Because Drupal is so modular it is not even remotely possible to use the common Class_Name -> Directory/Name mapping pattern, which has all kinds of other flaws anyway. That's not even on the table. It's also off topic for this thread. :-) I was just pointing out that sun is correct that we don't need to explicitly load pager.inc 99% of the time.
Comment #51
simeI satisfied myself that there was nothing suspicious in #45.
I did a big hack of D6 and D7, piping all includes (where possible) to a function where I could measure the time take to include the file. Call it poor-mans-profiler.
So there are about 15 extra includes in D7 on logged in /user. On my machine with APC simply including these files adds up to at least 2ms, even 3ms. In some of my tests this represented 10% of the average page load.
Can anyone confirm that includes, even with opcode cache, have this impact? Because even if we don't wish to merge inc files, we should flag it simply as "one of the reasons D7 is slower than D6".
Comment #52
simePut another way: if I can show that we gain, say, 1% speedup on #smallcore, by merging the field.module's .inc files - is that worth pursuing?
Comment #53
catchI'd very much like to see a before/after comparison - and it's not vast amounts of work to make a patch for that. It also somewhat impacts attempts to further split module files into includes for memory / non-APC savings -which is hotly debated and pushes us in the opposite direction.
I've also noticed we spend some time just including .tpl.php files - but not sure if that's the actual include, or the way in which we do it.
The hard thing though would be measuring impact - we need with apc/no apc, with apc.stat on and off, possibly different operating systems. I've tried to find reliable benchmarks just on things like require vs. require_once and there's precious little information about that on the internet, and what there is is inconclusive and contradictory.
Comment #54
peterx commentedHow wide can you go as far as changes?
Looking at D6, not D7, there are things that leap out and probably have not changed for D7. I enclose one example that I would compare on D7 if it fits in the range of viable changes. A page load starts with 0.72 ms:
SELECT name, filename, throttle FROM system WHERE type = 'module' AND status = 1 AND bootstrap = 1 ORDER BY weight ASC, filename ASCfollowed a short time later by 0.84 ms:
SELECT name, filename, throttle FROM system WHERE type = 'module' AND status = 1 ORDER BY weight ASC, filename ASCFrom a performance quick gain perspective, you would replace the first query with the second query and pass the result of the first query to the code that requires the second query. Both queries are in module_list making the change relatively easy. Update: This is now at http://drupal.org/node/623992 Reduce {system} database hits
Another example. The following query is executed 6 times. That appears to be once for content and once for every block. Whoever calls cache_get 6 times with the same query should cache the result in memory.
SELECT data, created, headers, expire, serialized FROM cache_nodewords WHERE cid = 'tags_info'Further down the page the same query is repeated another 6 times.
SELECT data, created, headers, expire, serialized FROM cache_nodewords WHERE cid = 'tags_info'Comment #55
simeFollow-up of #52 and #53. Just want to rule them out.
I focussed on Field module which currently loads 6 .inc files on every page. I combined the files together and then benchmarked a number of times. No discernible difference in performance. (I shut down Firefox and other apps to try and avoid anomalies.)
Comment #56
mattyoung commented.,.
Comment #57
yched commented/me is happy to not have to merge field's .inc into a "War and Peace"-sized file.
Comment #58
peterx commentedIs anyone testing with path aliases on a big menu?
http://drupal.org/node/625898 and http://drupal.org/node/625968 speed up menu creation in D6 by reducing database accesses. The menu system is changed in D7. If the same multiple alias lookup occurs as in D6, the menu system could use the path change to get all the aliases in one call then apply the aliases in one hit. That should reduce calls to the path functions. The stats for database accesses from devel are:
Before: Executed 595 queries in 207 milliseconds.
After: Executed 158 queries in 95.37 milliseconds.
The database calls went down by 437 but menu still called path 437 times to get aliases. A change to menu could eliminate those calls.
Comment #59
catch@peterx - we implemented a path whitelist and system path cache in Drupal 7 #456824: drupal_lookup_path() speedup - cache system paths per page. and #106559: drupal_lookup_path() optimization - skip looking up certain paths in drupal_lookup_path() which eliminated a very large number of database lookups for paths. However that sounds like a third approach which wouldn't necessarily conflict with what's already in there.
Comment #60
peterx commented@catch Thank you for the link to #456824: drupal_lookup_path() speedup - cache system paths per page. I searched path for similar issues and forgot to search menu. #456824 should reduce the system calls for the navigation menu. My change is aimed at the primary menu when used with drop downs and lots of entries. They can share the same cache.
I do not see changes in #456824 for menu. Does that mean menu still calls drupal_lookup_path many times in D7? My big primary menu appears to call drupal_get_path_alias() and that is the call that could be reduced to one, getting an array back when the input path is an array. I have not traced back from drupal_lookup_path or drupal_get_path_alias to where it is activated in menu.
Comment #61
catchSo the way it works in D7 is this:
All consumers of drupal_lookup_path() call it one by one.
We avoid database lookups by
1. Only hitting the database for whitelisted paths - if you never create an alias for a path at admin/* it'll never look for one either - this list is generated dynamically when new paths are added / removed.
2. Caching all the paths looked up per page when there's a cache miss, so that these can be queried with a single IN() query - once the cache is primed, individual cache misses are looked up one by one.
So between your menu patches, I think it would make sense for drupal_lookup_path() to additionally accept an array of system paths (from menu, possibly elsewhere) - this would then reduce the number of path lookups where the system paths cache hasn't been primed, or where it's gone stale. However due to the optimizations which are already in there, it'd be less dramatic of a change to the number of queries on most pages - if we can do it without an actual change in the API though, then it seems like a good addition to what's already there.
Comment #62
peterx commented@catch D6 menu change worked out in #625968: Speed up path alias lookups in menu links. For the use case of the primary menu linking to nodes with aliases, drupal_lookup_path is called only once for the 400 links. menu passes the alias as part of the menu item and url() does not have to call drupal_lookup_path. The change might translate to D7.
Before: Executed 616 queries in 224.26 milliseconds.
After: Executed 178 queries in 97.14 milliseconds.
Comment #63
peterx commented@catch D6 menu change worked out in http://drupal.org/node/625968. For the use case of the primary menu linking to nodes with aliases, drupal_lookup_path is called only once for the 400 links. menu passes the alias as part of the menu item and url() does not have to call drupal_lookup_path. The change might translate to D7.
Before: Executed 616 queries in 224.26 milliseconds.
After: Executed 178 queries in 97.14 milliseconds.
Comment #64
casey commented@catch could you give us an updated graph of the one you provided in #34? I also would like to see such graphs for a node view and node edit. thnx.
Comment #65
peterx commentedI looked at a D6 node edit with devel and cache_get ran the following query six times, sometimes back to back. Might be an area to look.
SELECT data, created, headers, expire, serialized FROM cache_nodewords WHERE cid = 'tags_info'Comment #66
sun@peterx: Could you please stop derailing this issue with a nodewords issue? Please file a bug report here: http://drupal.org/project/nodewords
Comment #67
catchThree graphs attached. I'll repeat the offer made previously to get people up and running with this stuff themselves in irc.
Comment #68
jeremy commentedSubscribe.
Comment #69
yched commentedLinking to #438570-55: Field API conversion leads to lots of expensive function calls which has a proof-of-concept patch for enhancing field rendering performance (in short: formatters as render arrays instead of formatters as theme functions - see comment #52 over there for more details).
Help needed for benchmarks, because my setup notably sucks at perf measures.
Comment #70
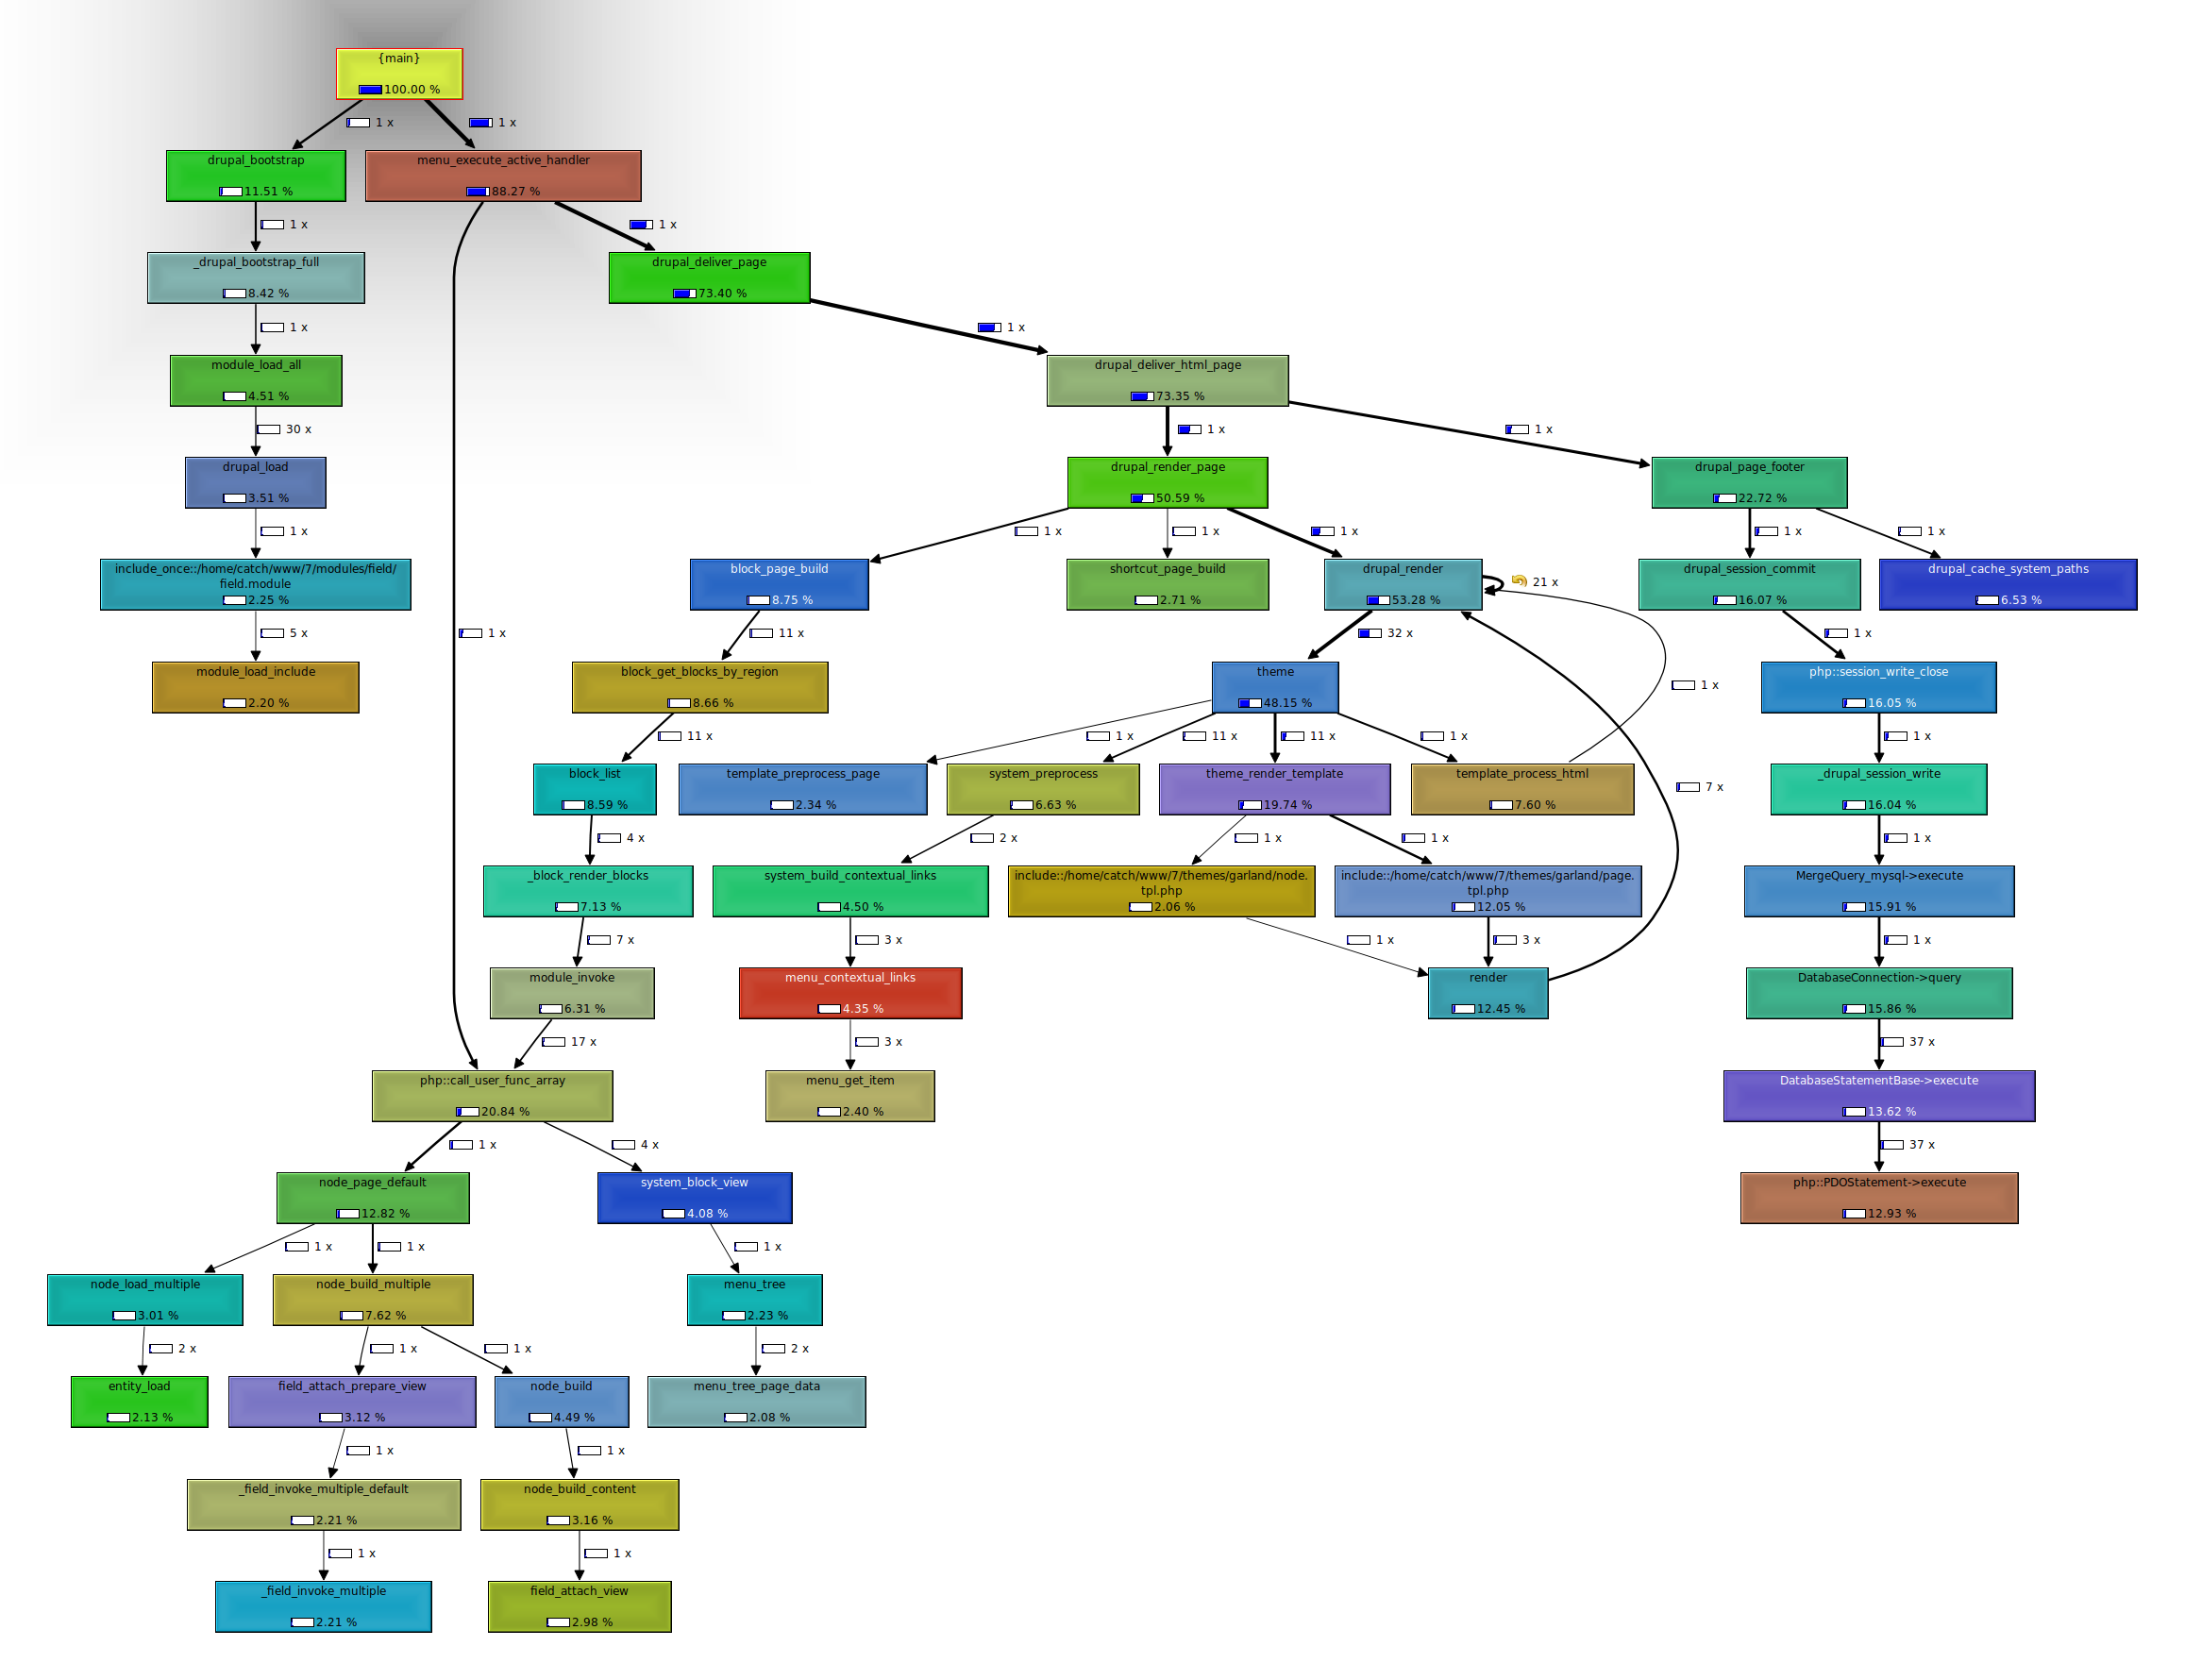
peterx commentedfront.png shows drupal_session_commit turning into 37 PDO executes. DatabaseConnection->query calls DatabaseStatementBase->execute 37 times. It looks like it should be one insert or one update followed by one insert. If this is session cleaning out 36 old sessions, it could be deferred to some sort of shut down task so it is not part of the page response.
Comment #71
carlos8f commentedsubscribe.
Comment #72
catch@peterx
That just means that 37 queries were executed on the page in total, but the most expensive one was from drupal_session_commit() - which would be right, since that's an insert query and the rest are selects.
Comment #73
sunWhere do we stand now? Would it be possible to also do some numbers that can be compared to the OP?
Unfortunately, #97293: Tablesort cleanup didn't see much traction so far - although this patch, along with a similar one for pager.inc, would save us from loading 2 completely unnecessary files on every request.
Additionally, I'm re-classifying this as critical bug.
D6 was slow already. If D7 becomes horribly slower, then many users will abandon it. This is no "soft decision" we can defer to later.
See also http://buytaert.net/speed-matters
Comment #74
carlos8f commentedIf people help with #638078: Automated performance testing for core, we can at least attempt to graph performance over time, potentially finding problem areas. Getting a Drupal-specific performance suite running is likely a necessity if we want to address the current performance WTF while preventing further regression.
Comment #75
sinasalek commentedTotally agree, Drupal is also a platform. How do people build upon an already slow platform?!
Thanks for all your efforts for addressing this issue guys
Comment #76
sunThe identical test suite/group of a contributed module...
compared in the same environment, repeatedly...
895 assertions...
D6 == 1 min 37 sec
D7 == 4 min 5 sec
EDIT: Coming from #663246: Port to Drupal 7
Comment #77
chx commentedsun care to try with skip-innodb ie make D7 tables MyISAM? I am quite sure some of that comes from the fact that we now default to InnoDB and that makes DDL slower however that's a rare enough operation and while it only slows down testing (because it installs so many tables) it does not slow down normal operation.
Comment #78
Juanlu001 commentedSubscribing.
Comment #79
q0rban commentedSubscribe
Comment #80
mcrittenden commentedSub.
Comment #81
plachComment #82
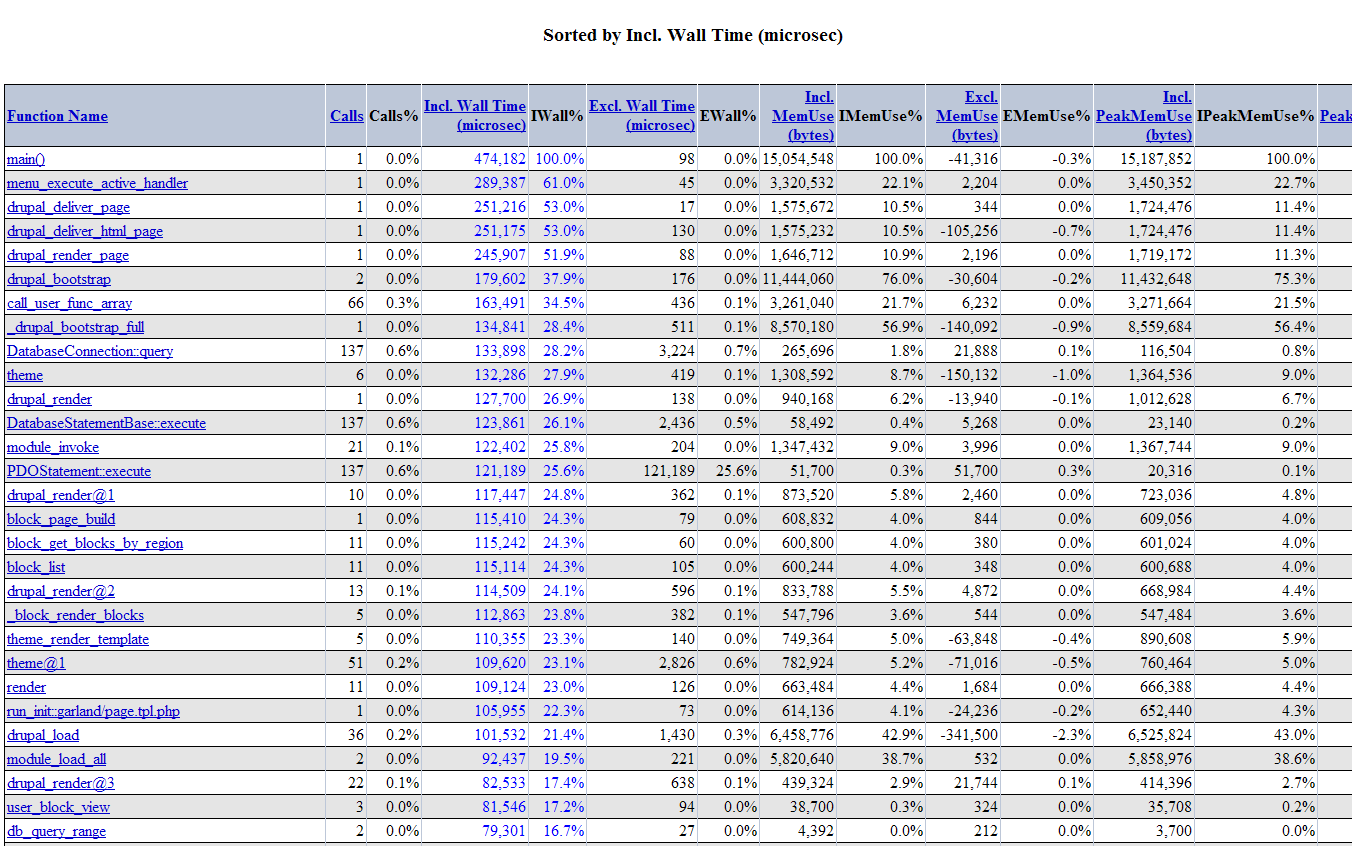
jon nunan commentedAnyone tried XHProf? Its an open source PECL package developed by the Facebook Dev team.
It has a web interface for browsing results and doesn't need to spend time 'grinding' to report them. You can even set it up so that a link is generated to view the current pages profile results. I've set it up temporarily on one of my sandobx sites: http://rugbybreakdown.net (click the 'profiler output' link at the bottom of the page to see the results.)
General notes:
load::file.inc - shows the resources used by include/require functions
main() - is just a dummy function that covers all scripts run on the request.
functionname@# - the @ sign indicates recursion, the number after it, the level of recursion
Screenshots attached, actually took these a day or so ago. Site is just Head with devel used to generate 500 pages/articles and a couple of blocks enabled.
xhprof_front_inclusive_walltime.png - the default view, orders top 100 functions by total time spent in them, including time taken by function calls inside them.
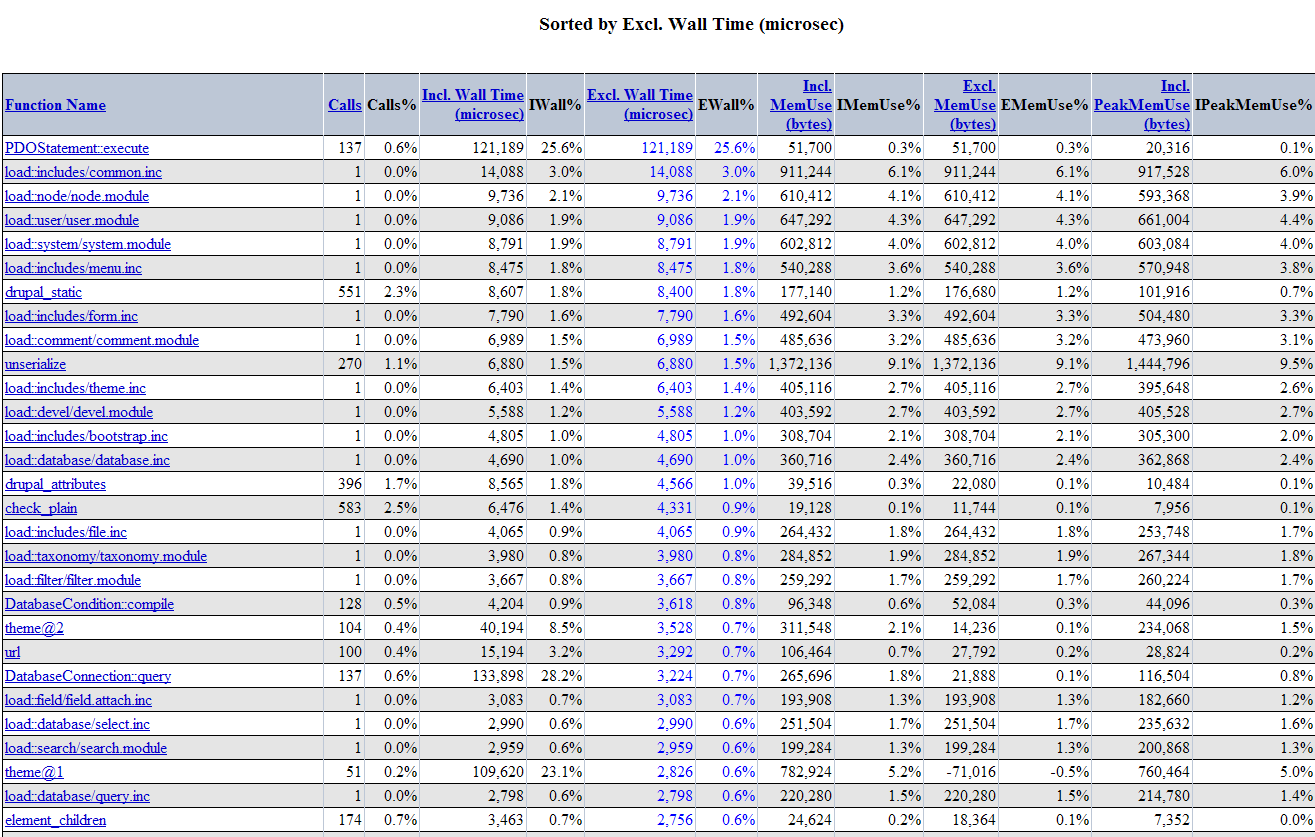
xhprof_front_exclusive_walltime.png - same table, but sorted by top 100 functions according to the time spent exclusively within them.
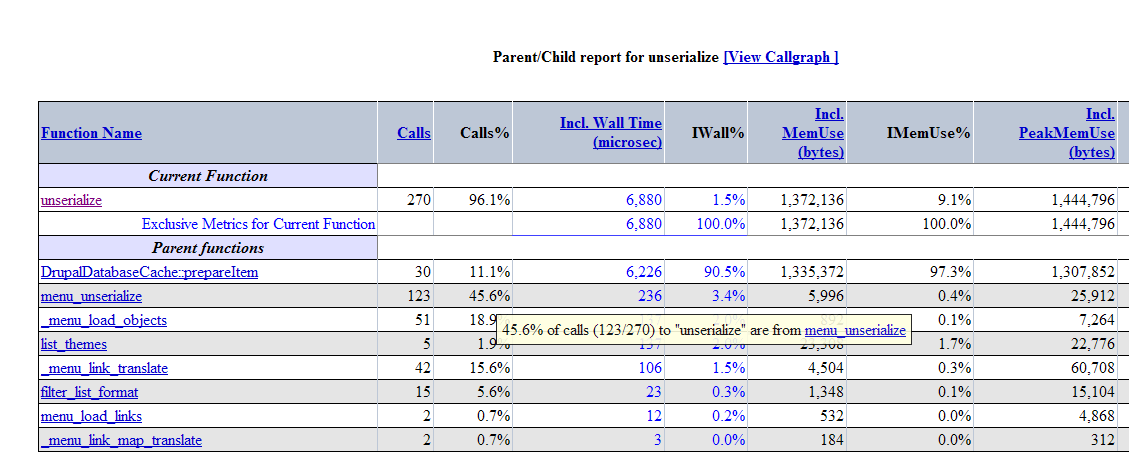
xhprof_front_unserialize_drill.png - you can drill down by clicking the function names, so if you saw above that unserialize seemed to be getting called a lot, you could see what was calling it.
It also supports cachegrind like callgraphs: http://rugbybreakdown.net/xhprof_front_callgraph.png (Warning large file size).
Another cool feature is that it can compare runs, showing diffs between the metrics given to run IDs (might help with patches?).
Comment #83
Crell commentedEeeentoresting. However, the callgraph PNG seems to give different results than the linked page. On the linked page, drupal_deliver_page is 34% of the page time while on the PNG it's 53%. That's a huge difference. Why would that be?
Comment #84
jon nunan commentedah sorry, the screenshots were taken from a couple day old checkout of drupal, with a couple of random patches, and I'd only run devel generate on nodes and not generated any user/taxonomy/comment entries. I decided to clean it up to be more defaulty before posting the link.
The current site link is a more recent checkout from Head. I also used the default devel generate on node/users/taxonomy (actually not totally default, as I think comments are off by default, think I set it to 5). So I assume the extra work of rendering comments/tags etc. may have caused it.
Also are you talking about a run you checked by visiting the page? I took all the screenshots logged in as user1, I assume you were visiting as an anonymous user...
Comment #85
sinasalek commentedInteresting
Comment #86
scroogie commentedVery nice meatsack. Could you add information about your setup? (PHP version, Bytecode cache?)
Comment #87
casey commentedHopefully you are using PHP 5.2 as it is said PHP 5.3 improved performance a lot for PDO.
http://www.php.net/ChangeLog-5.php#5.3.0 Added mysqlnd extension as replacement for libmysql for ext/mysql, mysqli and PDO_mysql. (Andrey, Johannes, Ulf)
25% on execution of queries is a lot...
/Edit ow wait, I am not sure whether mysqlnd is used by default...
I think there is a noticable difference between running Drupal 7 on PHP 5.2 and PHP 5.3
Comment #88
jon nunan commentedThat site (rugbybreakdown) is running on a VPS.net virtual machine with the turnkey linux lamp stack. I haven't done any tuning on it.
It has:
PHP Version 5.2.4-2ubuntu5.9
PHP.ini memory limit is 32M
I don't actually know if turnkey package any kind of opcode cache in their LAMP image, I see no signs of APC though and judging by the performance I'm going to guess there isn't any others running either.
Comment #89
peterx commentedDo you have Cpanel access? APC is usually off in Cpanel. Eaccelerator is the first option and you have to do some work to switch on APC. APC is better and is the standard for PHP 6.
Comment #90
jon nunan commentedCpanel isn't installed and it's a virtual machine and I've got full access. I tried installing APC, but I couldn't install apache2-threaded-dev for some reason (broken package). Going to re-install a non 'turnkey' image and see if I can get it installed then. The site will be offline for a bit.
Edit: it's back up, running on Debian now with memory_limit 128M and APC is now enabled.
Comment #91
scroogie commentedI think it's okay to have a very "defaulty" PHP installation. That is probably what most persons run. I was just curious. BTW, this could be part of the #638078: Automated performance testing for core
Comment #92
yched commentedCrosspost: Using meatsack's data (http://rugbybreakdown.net/xhprof/xhprof_html/?run=4b463a562db67&source=d...) to extract some info in #659788-18: [meta issue] theme('field') is too slow, which is inhibiting its more widespread use
Comment #93
jon nunan commentedyched I've started wrapping 'render' up in unique dummy functions in a copy of Garland.
e.g. Instead of
I'm putting
That way each render in the template can be identified. Does this help at all? I've only done it to node.tpl.php so far...
Comment #94
yched commentedre @meatstack #93: Yo! Helps quite a bit (although it might confuse other people trying to exploit the data :-p).
Comment #95
jon nunan commentedno problem, I've added a sticky to the domain so if people discover it outside this thread they know what's up. I think what'd be really sweet is a way to differentiate theme calls. I tried using 'create function' but all records were recorded under the same alias too.
It may just be the profiler adding loads that aren't necessary but rdf_preprocess_username seems to be adding a lot of load considering what it does. Could it be a candidate for caching at some level?
Comment #96
catchRDF has an RTBC patch at #636992: Entity loading needs protection from infinite recursion, and yes that's a huge sink at the moment.
Comment #97
moshe weitzman commentedI'm gonna close this. If it is still needed, please re-open a more targetted issue. IMO, this is a dupe of #513984: Find bottlenecks in HEAD - meta issue and thats a dupe of the Performance tag
Comment #98
yched commentedquestion to @meatsack: is http://rugbybreakdown.net/ updated with latest HEAD ?
Comment #99
jon nunan commentedran a cvs update and re-installed (about 20 hours ago from the time of this post). Seems I broke something though as when I devel generated new nodes all the node titles are printing 'Array'. Am checking to see what may have happened...
Comment #100
yched commented@meatsack: 'Array' is most probably the reversal of 'node title as a field'. devel module wasn't updated and still generates 'title' as an array (field value) instead of a string, and this gets saved as 'Array'. No big deal I guess.
What might help though, would be:
- if all generated nodes had the same amount of fields (some have taxo terms, some don't) - ideally, no taxo term :-p
- if somehow theme('field') was isolated in its own _theme_field() function call
Comment #101
jon nunan commented@yched: Yeah figured it was a new change and I wasn't sure whether my theme was outdated or if devel was... you're right it was devel.
- I've manually created 10 identical 'Articles' for now.
- I've put a wrapper around the render in field.tpl.php, though I get the feeling you're talking about something else. Only real place I noticed a theme call in field.module was in field_format() but that doesn't seem to get called... I'm probably just tired, but if you can explain it some more I can give it a shot.
Comment #102
catchSwapping the duplicates, I'd like to keep at least one critical meta issue for general benchmarking / profiling exchanges, and this has the more up-to-date information.
Comment #103
catchLooks like RDF needs more of a look through:
http://drupal.org/node/652246#comment-2478022
Comment #104
catchFresh benchmarks to see where we are.
I took a single node with no comments, disabled toolbar, shortcuts, RDF and contextual links which add both PHP and query overhead compared to D6, then ran devel as user/1, an authenticated user and anonymous, and benchmarks as an anonymous user with no page caching, xdebug off, APC on.
Drupal 6:
User 1: Executed 35 queries in 18.61 milliseconds. Page execution time was 60.86 ms.
Anonymous: Executed 36 queries in 22.44 milliseconds. Page execution time was 66.27 ms. (12 / 36 queries are cache_get())
Authenticated: Executed 39 queries in 22.24 milliseconds. Page execution time was 64.35 ms.
I think it's faster for user/1 due to some permissions checks being skipped, but didn't look into that.
Drupal 7:
User 1: Executed 34 queries in 20.52 milliseconds. Page execution time was 102.89 ms.
Anonymous: Executed 30 queries in 17.47 milliseconds. Page execution time was 89.09 ms. (17 / 30 queries are cache_get())
Authenticated: Executed 32 queries in 22.71 milliseconds. Page execution time was 87.46 ms.
Nearly all the time between user/1 and the authenticated user in D7 is taken by rendering the comment form for user/1 - switching that on adds ~15ms to request times (including some queries for filters).
Overall, still looks around 20% slower than D6 was, all that time being spent in PHP.
Comment #105
koala_b commentedCan we compare these new figures to the ones provided in #18 for D6 and #19 for D7?
If yes, the progress seems not so bad: D7 in november 2009 gave 69.8ms with 14.3 req/s, and now only 57.3ms and 17.4 req/s.
That's a gain of -18% in the speed and +22% of requests per second. Let say a 20% of improvement!
Good job!
Comment #106
catchI wouldn't trust them 100% - I only aim to keep benchmarks consistent for before/after, not so much across time. It'd be great if someone could do a cvs update -D "3 months ago" and try before after on the same page with that though.
Comment #107
yhager commentedsubscribing
Comment #108
sunre: chx/#77: Tried running tests with attached patch being applied. Testing tables were successfully created with MyISAM engine, but unfortunately, zero difference in performance.
Comment #109
sunSimilarly, I went ahead and forced SimpleTest to use the Minimal install profile when running tests. And ran the test group of http://drupal.org/project/mollom, which are almost exactly the same for D6 and D7.
However, D7 still took twice as long as D6.
Comment #110
carlos8f commentedI'm just getting kcachegrind and xdebug installed finally. Woot.
One issue of late is the performance of the installer on various shared hosting plummeting vs. D6 (taking 30+ seconds just to install system.module) #686196: Meta issue: Install failures on various hosting environments We're investigating whether InnoDB has to do with that, and I cross-linked the patch in #108. What is weird is that that same step in the installer takes 1 or 2 seconds on my machine, 5 or 6 on catch's laptop, and 30+ seconds on Godaddy. With 30+ seconds the installer crashes due to being over max_execution_time. All this while D6 installs swiftly on Godaddy with no problems.
Comment #111
catchThis issue has pretty much run its course now, work still needs doing but we've identified a lot of bottlenecks, and my last quick checks over core haven't found too many regressions, so downgrading from critical - if you find huge performance issues somewhere, feel free to open new, separate, critical bug reports of those of course, and tag them with 'Performance'.
Comment #112
ridgerunner commentedHi.
I see that this thread is active and is concerned with Drupal 7 performance.
I've sped up
drupal_staticby 4-6% (according to my simple benchmark tests). You may want to take a look. I'd like to see if your more elaborate tests yield similar results...#768090: drupal_static performance improvement
Comment #114
koala_b commentedPlease, add the tag "+Performance" to your issue http://drupal.org/node/768090
Comment #115
ridgerunner commentedThanks for pointing that out. I'm new to the Drupal development scene and am just learning how the process is supposed to work around here.
Comment #116
figaro commentedSix weeks after #111 it is fair to change status. New performance issues warrant their own thread.
Comment #117
Anonymous (not verified) commentedNot sure where a proper discussion about drupal 7 performance resides, but I did some minor xdebug trips in the code. Results pasted here: http://gist.github.com/432135
How would I best go on with these?
Comment #118
damien tournoud commented@jbergstroem: please open a separate issue for the array_key_exists() in drupal_static() and another one for the serialization alternatives. The first one is a no brainer, the second one might be more tricky.
Comment #120
effulgentsia commentedSorry to re-open this, but wondering if people who've worked on this issue have seen this blog post, claiming that the forum overview page is 60% slower in D7 than in D6.
If it's just the forum overview page, this issue should probably be re-closed, and a separate one opened just for that.
Or, is there a mismatch between the benchmarking done for that blog post vs. the ones done in this issue?
Or, has there been significant D7 performance regression after this issue was closed?
Comment #121
catchI personally haven't profiled the forum overview page, nor noticed it profiled anywhere until killes' blog post, so I wouldn't be surprised if there's been a regression on just that page since D6 that hasn't been picked up yet.
I /have/ done a reasonable amount of profiling of real Drupal 7 installs (but less so core by itself recently), and haven't noticed major regressions in general recently.
Comment #122
jon nunan commentedDon't compare these to my earlier call graphs. Those were on a Linux VPS and these are from my new work machine which is Windows. I installed 6.20, devel generated some vocabs and some forum posts, then copied it all to a new site which I upgraded to d7 RC2. Went to the forum page, logged out, default settings and refreshed a couple of times before grabbing the xhprof data below. There is no APC or the like, so a fair chunk of time is the loading of files.
General overview: http://imgur.com/IIkhu.png (I think the windows XHProf is still a bit buggy, the important numbers are bolded though)
D6 Callgraph: http://i.imgur.com/duqvC.png
D7 Callgraph: http://img340.imageshack.us/i/upgradedtod7.png/ (imgur was choking on the upload).
Comment #123
sunFor those graphs to make sense, can we redo them with the cufa() fix in module.inc as we did previously in #38 resp. #13 ?
Comment #124
catchVery old but very serious: #402896: Introduce DrupalCacheArray and use it for drupal_get_schema()
Comment #125
catchClosing this down, performance tag is working well enough for this (and lots of patches on there to review).
Comment #126
lpalgarvio commentedsub