
This project is not covered by Drupal’s security advisory policy.
About the Project
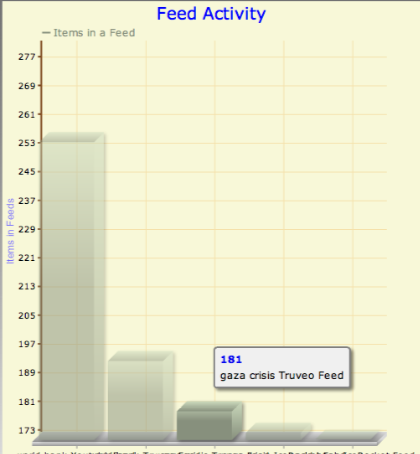
Provides a "charts" style output for Views module so you can render result-set not just as text (list, tabular) but as pie-chart, bar-chart, scatter-plot etc.
DC DrupalCon '09 Presentation
Dependencies
Suggested modules
- For Drupal 6 you will need the Views GroupBy: if you want to chart anything actually useful. Views 3 for Drupal 7 has grouping built in.
Documentation
Views Charts has basic usage instructions available as Advanced Help pages. Please install and enable it to see the available help.
Please report any problems at the projects issue queue.
Credits
The Drupal 7 version is sponsored by UNICEF Uganda for the Devtrac Project.
rsevero's co-maintainership was sponsored by Fábrica de Ideias.
Supporting organizations:
Sponsored the Drupal 6 version
maintains this module
Project information
- Project categories: Administration tools, Integrations, Developer tools
 102 sites report using this module
- Created by irakli on , updated
 This project is not covered by the security advisory policy.
Use at your own risk! It may have publicly disclosed vulnerabilities.


