
This project is not covered by Drupal’s security advisory policy.
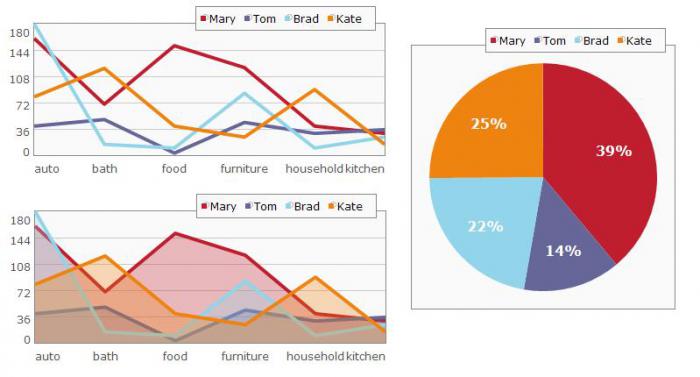
Visualize is a Views style plug-in for implementing the jQuery Visualize charting tool.
jQuery Visualize provides accessible charts providing textual information to non-visual users.
It uses a technique with JavaScript to scrape data from an HTML table and generate charts using the HTML 5 Canvas element.
This plug-in is tested in the following browsers: IE6, IE7, IE8, Firefox 2, Firefox 3.5, Safari 3 and 4, Opera 9.
Installation Instructions
- Enable this module at Administer >> Site building >> Modules.
- Download jQuery Visualize Plugin from http://www.filamentgroup.com/lab/jquery_visualize_plugin_accessible_char...
- Place the content of the ZIP file inside /visualize/jquery_plugin folder
- Create or edit a View and choose "jQuery Visualize" as style plugin
Project information
- Project categories: Content editing experience, Developer tools, Integrations
- Created by javi-er on , updated
 This project is not covered by the security advisory policy.
Use at your own risk! It may have publicly disclosed vulnerabilities.


