Profiling a Twig template
General Setup
System
- *AMP
- Git
- XHProf
Tools
- Drupal 8 -
git clone http://git.drupal.org/project/drupal.git - Drush 7 - latest install latest with drush
- Fabianx’s xhprof-kit
- Cottser’s xhprof kit alias/scripts for bbranch, branches and ubranch
XHProf Install
Instructions for your particular environment can be found here:
https://drupal.org/node/946182
XHProf Kit Install
See https://github.com/LionsAd/xhprof-kit.
1) Clone the xhprof-kit repository. It doesn't really matter where you clone it on your local, as long as it's not inside your document root.
git clone git://github.com/LionsAd/xhprof-kit.git
2) While in the xhprof-kit directory, download xhprof as a Git submodule:
git submodule init
git submodule update
3) While in the Drupal directory you want to benchmark, run setup-directory.sh in xhprof-kit using the full path: /full/path/to/xhprof-kit/setup-directory.sh.
This creates a xhprof-kit symlink in the directory.
Make sure symlinks are allowed in Apache configuration.
4) 127.0.0.1
Currently XHProf-Kit assumes that Drupal is installed at 127.0.0.1. If you use a virtual host, you will need to change the URL in find-min-web.sh or export a value for $XHPROF_KIT_DOCROOT, for example:
export XHPROF_KIT_DOCROOT="d8.dev".
XHProf Kit Aliases Install
Save the xhprof-kit.sh to your home folder at ~/bin/xhprof-kit.sh
Make sure it's executable:
chmod u+x ~/bin/xhprof-kit.sh
If you already have an API key:
Update the API Key for ubench (Optional if you want to upload the results)
./xhprof-kit/upload-bench.sh <strong>"APIKEY" API-IDENTIFIER</strong> $1 `git rev-parse --abbrev-ref HEAD`
Then finally source your script in your ~/.bash-profile by adding:
source ~/bin/xhprof-kit.sh to the bottom.
And open a new terminal window and test out bbranch.
Running Notes
- Disable XDebug (don't load it at all), because it makes it slower and results are slightly less reliable (source).
- Turn off most programs that may fluctuate the CPU or RAM.
- One way to do this on a mac is to hold down the shift key while you login in order to disable login items.
- Try not to use Chrome while profiling.
- Drupal needs to be on the default site for cache clearing to work (so don't use multi-site for profiling).
Tips and Tricks
- Check that your ct (function calls) between the 8.x core and twig branch are different.
- Enable Twig debug to make sure you are using Twig on the branch for your scenario. (Add the line
$settings['twig_debug'] = TRUE;to settings.php and view source for debug output). But be sure to disable twig_debug again before gathering benchmarks. - Disable the render cache: add
$settings['cache']['bins']['render'] = 'cache.backend.null';to settings.php. - Currently, the previous two steps are in the file sites/example.settings.local.php .
- Run bbranch a few times to warm up the tests and the CPU seems to provide more accurate results on the baseline vs 8.x
- When switching between branches and when enabling/disabling Twig debugging, use
$ drush crto clear caches so that the changes will take effect.
Twig Profiling
To be able to upload runs for others to see, ping @Fabianx on IRC for an API key.
Recommended profiling workflow
- Enable the APC class loader in settings.php.
- Create Issue Branch - Create a new branch from 8.x to test the patch in question, e.g.
user-1898468-91and commit the Twig conversion patch in that branch (e.g.git apply --index user-1898468-91.patch; git commit -m "apply patch"). - Set Drupal Homepage - Since the profiling only looks at the homepage of your site, you need to setup your local drupal site to display the appropriate page on the homepage and ensure it is visible to anonymous users. If that's not possible or if you prefer you can edit the URL directly in find-min-web.sh within xhprof-kit.
- Set Anonymous role to have all permissions.
- Review the Issue in question to determine how you can reproduce the issue on a page on your site.
- Set the homepage to the correct url on Site Information (/admin/config/system/site-information) -- or use:
drush cset system.site page.front "path/goes/here") - Example: if you’re testing the user.tpl.php conversion to Twig, allow anonymous users to view user profiles and set the homepage to user/1.
Run profiling
To continue with the example of user.tpl.php profiling, we have a user-1898468-91 branch with the Twig conversion committed to it and the scenario is set up so that anonymous users can view it on the homepage (with Stark theme enabled and a Twig template being rendered somewhere on the page such as a node or a user profile). Once all that is in place:
- Switch to 8.x:
git checkout 8.0.x - Run
bbranch
You should get output like this:
loop time: |0.345511s|51978cc86c728|drupal-perf|8.x|<a href="http://d8prof.dev/xhprof-kit/xhprof/xhprof_html/index.php?source=drupal-perf&url=%2F&run=51978cc86c728&extra=8.x" target="_blank">Profiler output</a>Copy the XHProf run ID from bbranch, e.g. 51978cc86c728
Run bbranches 51978cc86c728 user-1898468-91 to compare your current branch (8.x) against the Twig conversion branch. Note that the command is now bbranches, not bbranch.
Once that finishes running you should have something like this:
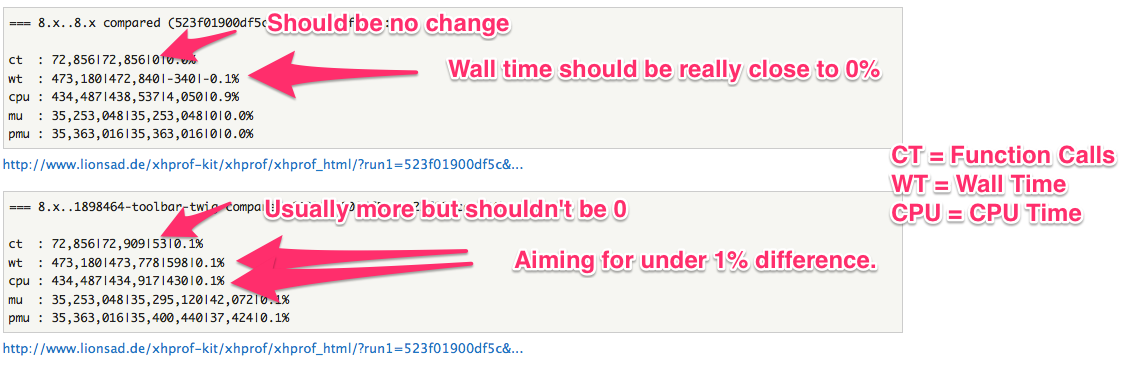
=== 8.x..8.x compared (51978cc86c728..51978d2b1f3d1): ct : 33,570|33,570|0|0.0% wt : 345,567|345,166|-401|-0.1% cpu : 315,116|314,178|-938|-0.3% mu : 30,324,000|30,324,000|0|0.0% pmu : 30,433,448|30,433,448|0|0.0% <a href="http://d8prof.dev/xhprof-kit/xhprof/xhprof_html/index.php?source=drupal-perf&url=%2F&run1=51978cc86c728&run2=51978d2b1f3d1&extra=8.x..8.x">Profiler output</a> === 8.x..user-1898468-91 compared (51978cc86c728..51978d4d92dd9): ct : 33,570|33,703|133|0.4% wt : 345,567|345,816|249|0.1% cpu : 315,116|314,995|-121|-0.0% mu : 30,324,000|30,345,720|21,720|0.1% pmu : 30,433,448|30,456,824|23,376|0.1% <a href="http://d8prof.dev/xhprof-kit/xhprof/xhprof_html/index.php?source=drupal-perf&url=%2F&run1=51978cc86c728&run2=51978d4d92dd9&extra=8.x..user-1898468-91">Profiler output</a> For the first 8.x..8.x comparison we don’t want the wt to fluctuate much at all - that is our baseline comparison to show that the first run (from bbranch) is still accurate, because that is what is being used to compare against these two new runs. You may have to go through this process (run bbranch, get run ID, run bbranches with new run ID) a few times to get a low wt fluctuation, we generally want something under +–0.5% but less is better. Don’t waste all day trying to get a 0% fluctuation though :)
Post results
Once you have a comparison you’re happy with, (and you have an API key from @Fabianx) you can run:
ubench 51978cc86c728
Where 51978cc86c728 is the baseline run used for comparing, originally from bbranch.
Then you’ll get something like this:
Run 51978cc86c728 uploaded successfully for drupal-perf-cottser. Run 51978d2b1f3d1 uploaded successfully for drupal-perf-cottser. === 8.x..8.x compared (51978cc86c728..51978d2b1f3d1): ct : 33,570|33,570|0|0.0% wt : 345,567|345,166|-401|-0.1% cpu : 315,116|314,178|-938|-0.3% mu : 30,324,000|30,324,000|0|0.0% pmu : 30,433,448|30,433,448|0|0.0% http://www.lionsad.de/xhprof-kit/xhprof/xhprof_html/?run1=51978cc86c728&run2=51978d2b1f3d1&source=drupal-perf-cottser&extra=8.x..8.x Run 51978cc86c728 uploaded successfully for drupal-perf-cottser. Run 51978d4d92dd9 uploaded successfully for drupal-perf-cottser. === 8.x..user-1898468-91 compared (51978cc86c728..51978d4d92dd9): ct : 33,570|33,703|133|0.4% wt : 345,567|345,816|249|0.1% cpu : 315,116|314,995|-121|-0.0% mu : 30,324,000|30,345,720|21,720|0.1% pmu : 30,433,448|30,456,824|23,376|0.1% http://www.lionsad.de/xhprof-kit/xhprof/xhprof_html/?run1=51978cc86c728&run2=51978d4d92dd9&source=drupal-perf-cottser&extra=8.x..user-1898468-91 What to look for
Where to go from here
#1757550: [Meta] Convert core theme functions to Twig templates
Another approach
@claudiu.cristea took a different approach with jmeter. Have a look and you can give this a whirl as well. Here's a great write-up for testing the image module conversion:
http://webikon.com/cases/drupal-twig-conversion-performance-test-with-jm...
Background and reference information
Help improve this page
You can:
- Log in, click Edit, and edit this page
- Log in, click Discuss, update the Page status value, and suggest an improvement
- Log in and create a Documentation issue with your suggestion
