XHProf Code Profiler
This documentation needs review. See "Help improve this page" in the sidebar.
XHProf is a utility for profiling PHP. Unlike Xdebug profiling, it profiles both CPU cycles and memory usage (Xdebug 2.0.0RC4 and later only provides memory usage information in function traces).
Pre-requisites
Figure out where your php.ini file is:
php -i | grep php.ini
XHProf Install
The following are the setup instructions for various platforms.
Originally from the contributor task profiling documentation: https://drupal.org/node/1999108
Acquia Cloud IDE
Xdebug is preconfigured in Cloud IDE.
Cloud IDE allows you to enable and disable Xdebug with the acli ide:xdebug-toggle command.
ide:~/project $ acli ide:xdebug-toggle
xDebug enabled.
ide:~/project $ acli ide:xdebug-toggle
xDebug disabled.
To override the default settings (Advanced):
- In your Cloud IDE, locate the
/home/ide/configs/php/xdebug.inifile. - Modify any of the following configuration settings but do not uncomment the
;zend_extension=xdebug.soline manually. Useacli ide:xdebug-toggleto enable or disable Xdebug as instructed earlier:
; Acquia Hosting XDebug defaults
; This file configures the default settings for xdebug.
[xdebug]
zend_extension=xdebug.so
xdebug.mode=develop
xdebug.client_host=127.0.0.1
xdebug.client_port=9001
xdebug.max_nesting_level=3000
xdebug.log = /tmp/fcso_debug.log
- To apply the changes you’ve made, restart PHP-FPM by running the following command:
acli ide:service-restart php
-
For an introduction on using Xdebug with Cloud IDE, follow the best practices outlined in Using Xdebug.
MAMP
See also: Installing XHProf for MAMP on Mac OS 10.6 (Snow Leopard) if you are using MAMP.
(Get the xhprof.so from https://github.com/cam8001/php-xhprof-mamp but note that the xhprof.output_dir is different in these instructions.)
1) Copy xhprof.so to /Applications/MAMP/bin/php/php5.x.x/lib/php/extensions/no-debug-non-zts-200xxxxx/ (replacing x with your PHP version and xxxxx with the date on the existing extensions dir)
2) Add the following lines to your php.ini (Open MAMP click on File → Edit Template → PHP → PHP 5.x.x php.ini)
extension=xhprof.so
xhprof.output_dir=/tmp
Mac (with Homebrew PHP)
brew install php54-xhprof (or whatever PHP version you're running).
Then edit your ext-xhprof.ini at e.g. /usr/local/etc/php/5.4/conf.d/ext-xhprof.ini to add:
xhprof.output_dir=/tmp
Ubuntu
Use pecl:
pear channel-update pear.php.net
pecl install xhprof
or
pecl install channel://pecl.php.net/xhprof-0.9.4
apt-get install php5-dev
or
apt-get install php-xhprof
phpenmod xhprof
Add the xhprof config /etc/php5/conf.d/xhprof.ini:
[xhprof]
extension=xhprof.so
xhprof.output_dir=/tmp
Manual
These are useful if you want a different version of XHProf, e.g. 0.9.4.
- Download from PECL -
pecl d xhprof-0.9.4. Confirm this is the latest version of xhprof before downloading - Extract the xhprof PECL package -
tar xzf xhprof-0.9.4.tgz - Compile the xhprof package.
cd xhprof-0.9.4/extension
phpize
./configure
make
sudo make install
Verify XHProf is installed
To verify that xhprof is installed and working, run the following:
php -i | grep xhprof
You should see output similar to the following:
xhprof
xhprof => 0.9.4
If not, check the installation instructions above (make sure to restart your web server!) accordingly. Make note of the version number for later.
Capturing and viewing XHProf output
XHProf module
The easiest way is to get up and running is to download and enable the XHProf module. For details see - download contributed modules, themes and their dependencies using Composer
composer require drupal/xhprof

drush en xhprof -y
Turn on and configure page profiling at admin/config/development/xhprof.
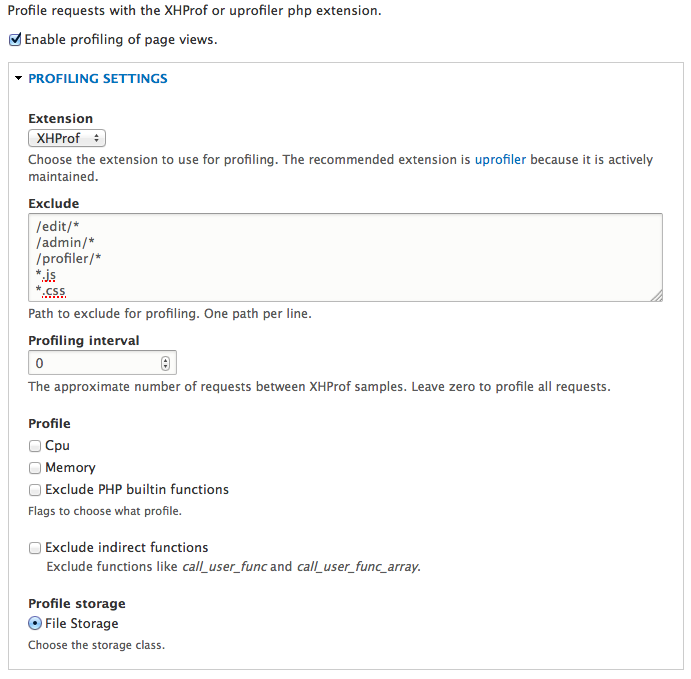
After saving the form, all pages will have a small "XHProf output" link in the page footer. Click it to view the output of that page, or go to admin/reports/xhprof for a list of all reports.
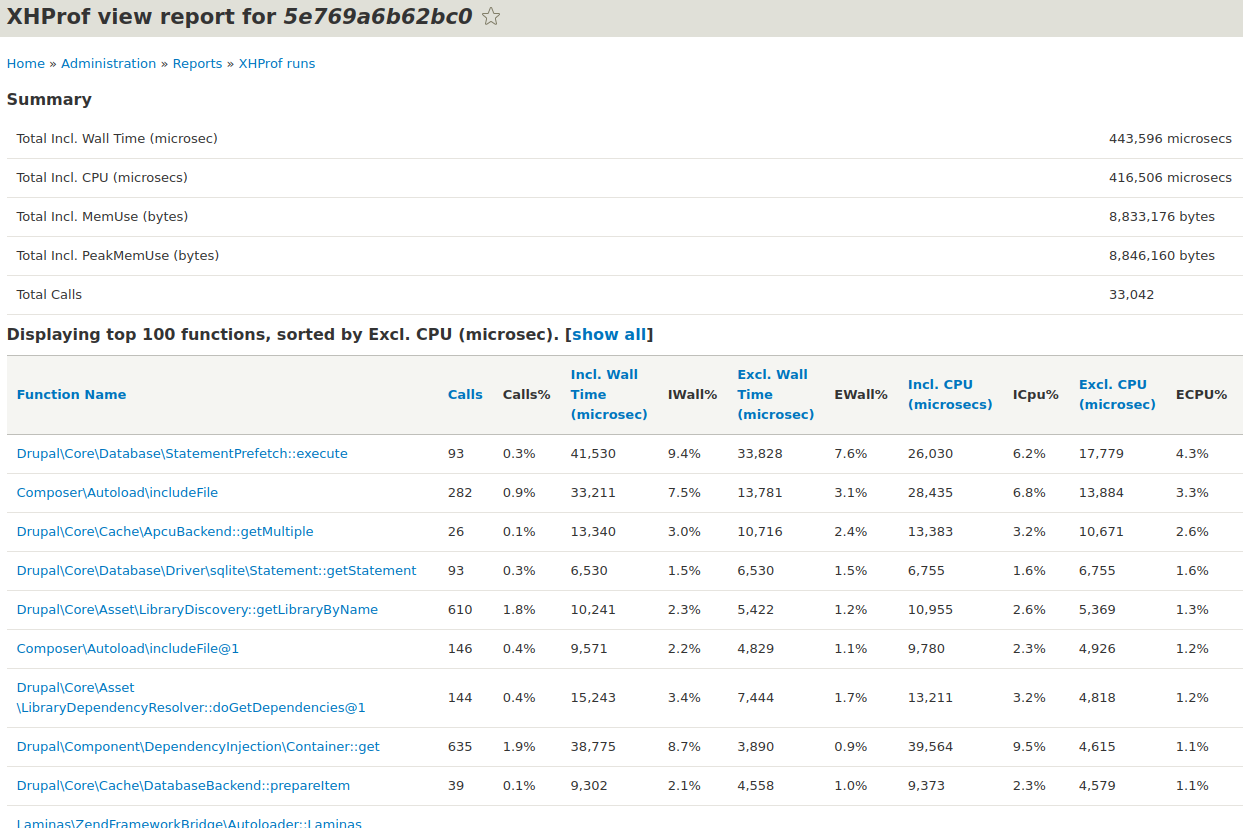
Unfortunately, the Drupal implementation of XHProf lacks the ability to view the 'callgraph' - this is a really useful chart of how the functions all relate to each other and helps to visualize what is going on.
Capturing and viewing XHProf output in a CLI Drupal Web Test
Certainly not the best/only way, but maybe it will help to give your project lift:
If you're using run-tests.sh to test via command line PHP, you will need to tell xhprof when to start capture, when to stop, and when/where to write its captured output. With the xhprof module enabled in your test Drupal instance, xhprof can be added to your WebTestCase class. Our web tests extend the core DrupalWebTestCase.
In setUp():
    if (module_exists('xhprof')) {
      module_load_include('module', 'xhprof');
      xhprof_include();
    }
And add two more helper methods, xhprof_start() and xhprof_stop():
  /**
   * Start xhprof profile collection.
   */
  public function xhprof_start() {
    if (module_exists('xhprof')) {
      xhprof_enable(XHPROF_FLAGS_CPU + XHPROF_FLAGS_MEMORY);
    }
  }

  /**
   * Stop xhprof profile collection session.
   * @return string XHProf formatted output ID or string message that none is available.
   */
  public function xhprof_stop() {

    if (module_exists('xhprof')) {
      $xhprof_data = xhprof_disable();
      $class = variable_get('xhprof_default_class', 'XHProfRunsFile');
      $xhprof_runs = new $class();
      return $xhprof_runs->save_run($xhprof_data, 'My Drupal Project');
    } else {
      return 'XHProf module not enabled in this Drupal test db.';
    }

  }
Then, when you want to test something, wrap your tested snippet with start and stop like:
    $this->xhprof_start();
    // call your nasty function full of stink that needs profiling
    $xhprof_id = $this->xhprof_stop();
    // output your xhprof_id in a way that makes sense to you.. as an assert statement or print_r
    // and continue with your assertion and such
    $this->assert(...);
Capturing and viewing native XHProf output
Manually download and extract XHProf (make sure the version matches the PHP ini output above).
@todo
pecl d xhprof-0.9.4
sudo pecl install xhprof-beta (if that doesn't work try just xhprof)
tar xzf xhprof-0.9.4.tgz
To access the callgraphs, go to http://[xhprof.loc]/xhprof_html/index.php (or whatever you set up for your localhost of XHProf in step x) and click on any of the report numbers. There will be a link near the top that reads 'View Full Callgraph'. If you click on this and you get an error (instead of a nice chart) you probably need to install Graphviz. You can grab the .pkg for the appropriate version for your OS at http://www.graphviz.org/Download_macos.php. Click through the installation and then the graphs should work.
Help improve this page
You can:
- Log in, click Edit, and edit this page
- Log in, click Discuss, update the Page status value, and suggest an improvement
- Log in and create a Documentation issue with your suggestion
