
 Come together with the global Drupal community in Rotterdam, 28 Sept – 1 Oct 2026. Sessions, contribution, connection, and Early Bird savings until 8 June.
Big thanks for providing this module.
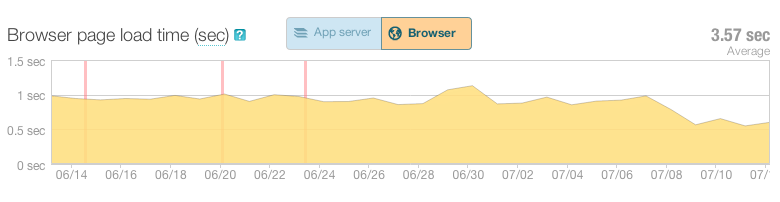
After enabling it we got a 300ms improvement in browser load time. This chart just shows the "DOM processing" time from the newrelic performance monitoring app.
cheers
UWE
| Comment | File | Size | Author |
|---|---|---|---|
| DOM_processing.png | 27.24 KB | mototribe |

Comments
Comment #1
jcisio commentedThanks for the nice screenshot!