
Closed (won't fix)
Project:
Drupal.org security advisory coverage applications
Component:
module
Priority:
Normal
Category:
Task
Assigned:
Unassigned
Issue tags:
Reporter:
Created:
4 Jan 2013 at 06:29 UTC
Updated:
25 May 2013 at 16:27 UTC
Jump to comment: Most recent file


Comments
Comment #1
jooplaan commentedCool initiative and good intergration with views. Looking through the code it seems well documented. Also clear instructions on how to use the module.
There code style issues found, that are easy to fix:
http://ventral.org/pareview/httpgitdrupalorgsandboxsrutheesh1876988git
Comment #2
ahlofan commentedIt seems to be a very cool tools!
So far no errors blocking my testing... a few things I'd like to mention.
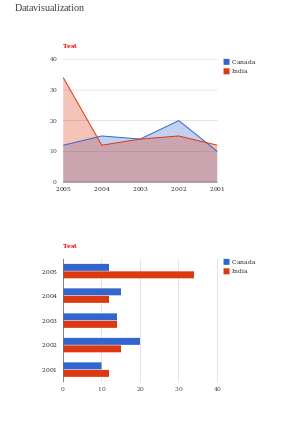
- In the Views UI, I think it would be better to display Google Data Visualization instead of google_data_visualization.
- I know the display is done through JS, but could it be possible to display in the preview section?
- Played around, not too sure how to set fields in the X/Y axis, can you provide more document?
Comment #3
klausihttp://drupal.org/project/visualization
http://drupal.org/project/chart
This sounds like a feature that should live in the existing projects. Module duplication and fragmentation is a huge problem on drupal.org and we prefer collaboration over competition. Please open an issue in the appropriate issue queue to discuss what you need. You should also get in contact with the maintainer(s) to offer your help to move the project forward. If you cannot reach the maintainer(s) please follow the abandoned project process.
If that fails for whatever reason please get back to us and set this back to "needs review".
Comment #4
srutheesh commentedHello klausi,
This is enterly different project from the mentioned projects, it is very user friendly and usable. I have faced lots of difficulty to build such a module so please coperate and the reason for the same is i have faced difficuly to implement google charts by using availiable modules.
Comment #5
srutheesh commentedHello ahlofan,
Thanks for your valuable feedback. I have fixed your following comments
- In the Views UI, I think it would be better to display Google Data Visualization instead of google_data_visualization. Fixed
- I know the display is done through JS, but could it be possible to display in the preview section? - Fixed
Thanks
Srutheesh
Comment #6
srutheesh commentedHow this module differ fom other modules Module.
Related Module.
Comment #7
srutheesh commentedComment #8
vladimir-m commentedHello,
Thank you for great module!
Manual review:
1. In File
google_data_visualization.infoyou have declared twicedependencies[] = views, at Line: 3 and Line: 42. Then I enabled the module my local environment crashed.
Here is a snippet from apache error.log
Comment #8.0
srutheesh commentedReview bonus updated.
Comment #9
srutheesh commentedhi vladimir-m ,
Thank you for your valuable comment, There was an error after fixing the coding standered in that mentioned line. now it is fixed and the module is working fine please check it.
Thank you,
srutheesh
Comment #10
klausiDon't forget to add the "PAReview: review bonus" tag as indicated in #1410826: [META] Review bonus, otherwise you won't show up on my high priority list.
Comment #10.0
klausiReviewed module comment link updated.
Comment #10.1
srutheesh commentedPAReview link updated.
Comment #11
srutheesh commentedHi klausi,
I have added the reviews of other projects links here with the summary.
Thank you
Srutheesh
Comment #12
klausiStill, you forgot to add the "PAReview: review bonus" tag?
Removing the other strange tag.
Comment #13
srutheesh commentedHello klausi,
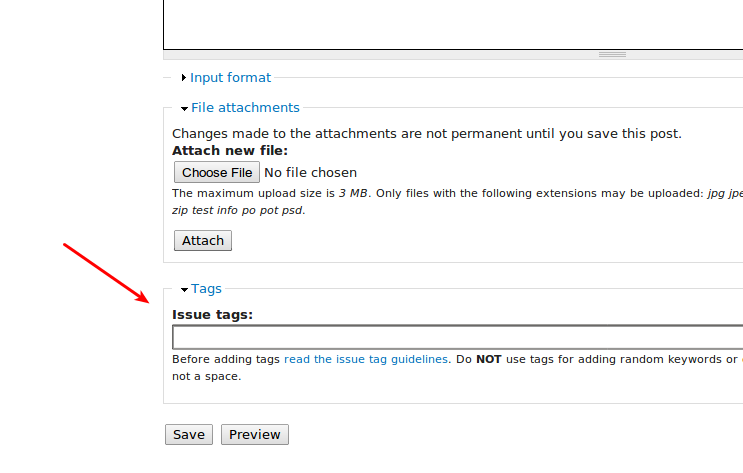
I couldn't find the "PAReview: review bonus" tag. I can see only two tags like "PAReview.sh" and "PAReview.sh online service" tags, How can i add the metioned tags tag, please help me.
Thank you,
Srutheesh
Comment #14
klausiSee this screenshot where to add issue tags:
Comment #15
srutheesh commentedThank you for your guide klausi.
I have added the "PAReview: review bonus".
Thank you,
Srutheesh
Comment #16
klausiPlease make sure to do more comprehensive manual reviews for your next review bonus, not just posting output of automated review tools.
It appears you are working in the "master" branch in git. You should really be working in a version specific branch. The most direct documentation on this is Moving from a master branch to a version branch. For additional resources please see the documentation about release naming conventions and creating a branch in git.
Review of the master branch:
This automated report was generated with PAReview.sh, your friendly project application review script. You can also use the online version to check your project. You have to get a review bonus to get a review from me.
manual review:
Removing review bonus tag, you can add it again if you have done another 3 reviews of other projects.
Comment #17
srutheesh commentedComment #17.0
srutheesh commentedDescription updated.
Comment #18
srutheesh commentedComment #18.0
srutheesh commentedReviewed comment link added.
Comment #19
klausiThere is still a master branch, make sure to set the correct default branch: http://drupal.org/node/1659588 . Then remove the master branch, see also step 6 and 7 in http://drupal.org/node/1127732
I'm confused - which branch should I review, master or 7.x-1.x? Because the most recent commits seem to be on master?
Comment #20
srutheesh commentedHello klausi,
I have removed all the updated files to 7.x-1.x branch and i have removed the master branch. I have incorperated all the mentioned changes to 7.x-1.x branch.
Thank you,
Srutheesh
Comment #20.0
srutheesh commentedremoved wrong link
Comment #21
srutheesh commentedComment #22
klausiMaster branch is still there - did you forget to push your changes?
http://drupalcode.org/sandbox/srutheesh/1876988.git
Comment #22.0
klausiI have removed all the updated files to 7.x-1.x branch and i have removed the master branch. I have incorperated all the mentioned changes to 7.x-1.x branch.
Comment #23
srutheesh commentedHello klausi,
I have removed all the master branch.
Thank you,
Srutheesh
Comment #24
srutheesh commentedHello klausi,
I have removed all the master branch.
Thank you,
Srutheesh
Comment #25
klausiMaster branch is still there - did you forget to push your changes? See http://drupal.org/node/1127732
http://drupalcode.org/sandbox/srutheesh/1876988.git
Comment #26
srutheesh commentedI apologize for the mistakes.
I have removed the master branch and updted all the files are moved to 7.x-1.x branch. Please take the 7.x-1.x branch as mater module review.
Thank you,
Srutheesh
Comment #27
aendra commentedThis is rad -- I'm working on a visualization distribution and this seems to fill a need I have. Will review it over the next hour.
Also and unrelated: I invite you to join my burgeoning Drupal Visualization group which discusses all things viz-y. We'd love to have you with us!
Comment #28
aendra commentedIf you haven't yet, fix everything mentioned by Klausi in his earlier review! Please don't mark issues as "Ready for Review" again until you've done everything requested in previous reviews -- thanks!
✗ Automated Review
Review of the 7.x-1.x branch:
This automated report was generated with PAReview.sh, your friendly project application review script. You can also use the online version to check your project.
Source: http://ventral.org/pareview - PAReview.sh online service
✗ Manual Review
Comment #29
klausiProject 1: #1879654: Google Data Visualization
Project 2: #1879690: Google Data Visualization
As successful completion of the project application process results in the applicant being granted the 'Create Full Projects' permission, there is no need to take multiple applications through the process. Once the first application has been successfully approved, then the applicant can promote other projects without review. Because of this, posting multiple applications is not necessary, and results in additional workload for reviewers ... which in turn results in longer wait times for everyone in the queue. With this in mind, your secondary applications have been marked as 'closed(duplicate)', with only one application left open (chosen at random).
If you prefer that we proceed through this review process with a different application than the one which was left open, then feel free to close the 'open' application as a duplicate, and re-open one of the project applications which had been closed.
Comment #30
PA robot commentedClosing due to lack of activity. Feel free to reopen if you are still working on this application.
I'm a robot and this is an automated message from Project Applications Scraper.
Comment #30.0
PA robot commentedGit directory changed.