
This project is not covered by Drupal’s security advisory policy.
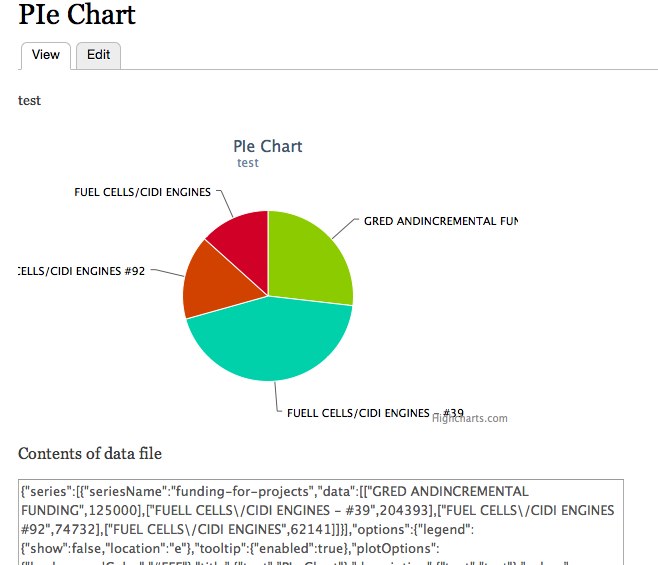
The data visualization api is a module that allows site builders to create, import & store data visualizations as entities and their data as standardized JSON. A user can then choose which installed data visualization library to use when rendering each data visualization entity.
All data is stored in a standardized format called Vizstruct. The spec for this specified JSON can be found here.
So far three adapters have been written to connect the Data Visualization API to individual rendering libraries. The adapter for Highcharts, JIT & jqPlot can be found here.
Features
- The ability to create and store Data Visualizations as entities.
- The ability to choose which rendering library you want for individual visualizations.
- Quick load times since the data is stored as JSON files and not database records.
- Integration with the Color module for easy color palette selection.
- The ability to place visualizations as blocks.
- Import Vizstruct objects from file
- Import data via CSV file
Requirements
- Entity API
- Libraries API
- Color
- Chaos Tools
- At least one rendering library installed: jqPlot, JIT or HighCharts.
Thanks:
zroger++ for providing architectual guidance for this module
fmitchell++ for helping prepare the module for submission to drupal.org
This module is sponsored by Treehouse Agency & The Department of Energy.
Project information
- Project categories: Content display, Developer tools
 2 sites report using this module
- Created by LSU_JBob on , updated
 This project is not covered by the security advisory policy.
Use at your own risk! It may have publicly disclosed vulnerabilities.


