
This project is not covered by Drupal’s security advisory policy.
Don't shoot us, it's another charting module!
There are certainly many charting modules available, including ones also implementing the Highcharts library. However as far as the maintainers*) are aware, this is the only one that also takes advantage of the special functionality of the HighchartTable jQuery library.
That makes this module unique for the following reasons:
- You can insert a chart above any numeric HTML table on any page with a single click. Whether the table was embedded into normal content using a WYSIWYG editor (CKeditor perhaps), produced by a Views plugin, a Webform results summary, it doesn't matter.
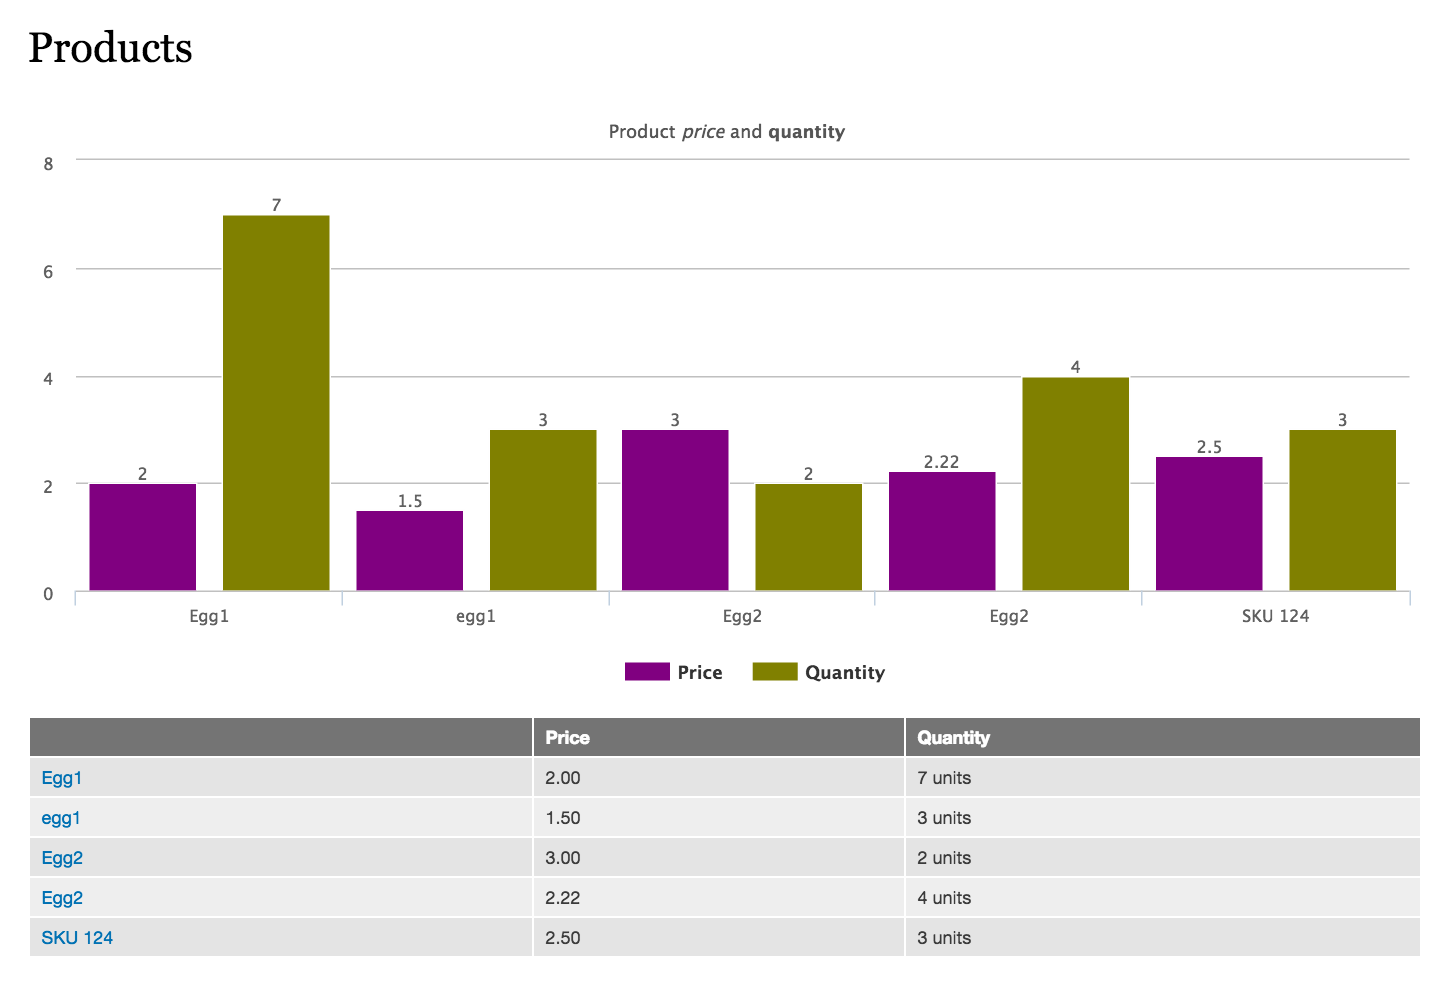
Any numeric table on your site may be adorned with a beautiful animated Highchart at the click of a link that appears above the table. By default, the first table column goes on the horizontal axis, the remaining columns become "series" plotted against the vertical axis. They can be flicked on and off by clicking their names on the chart legend.
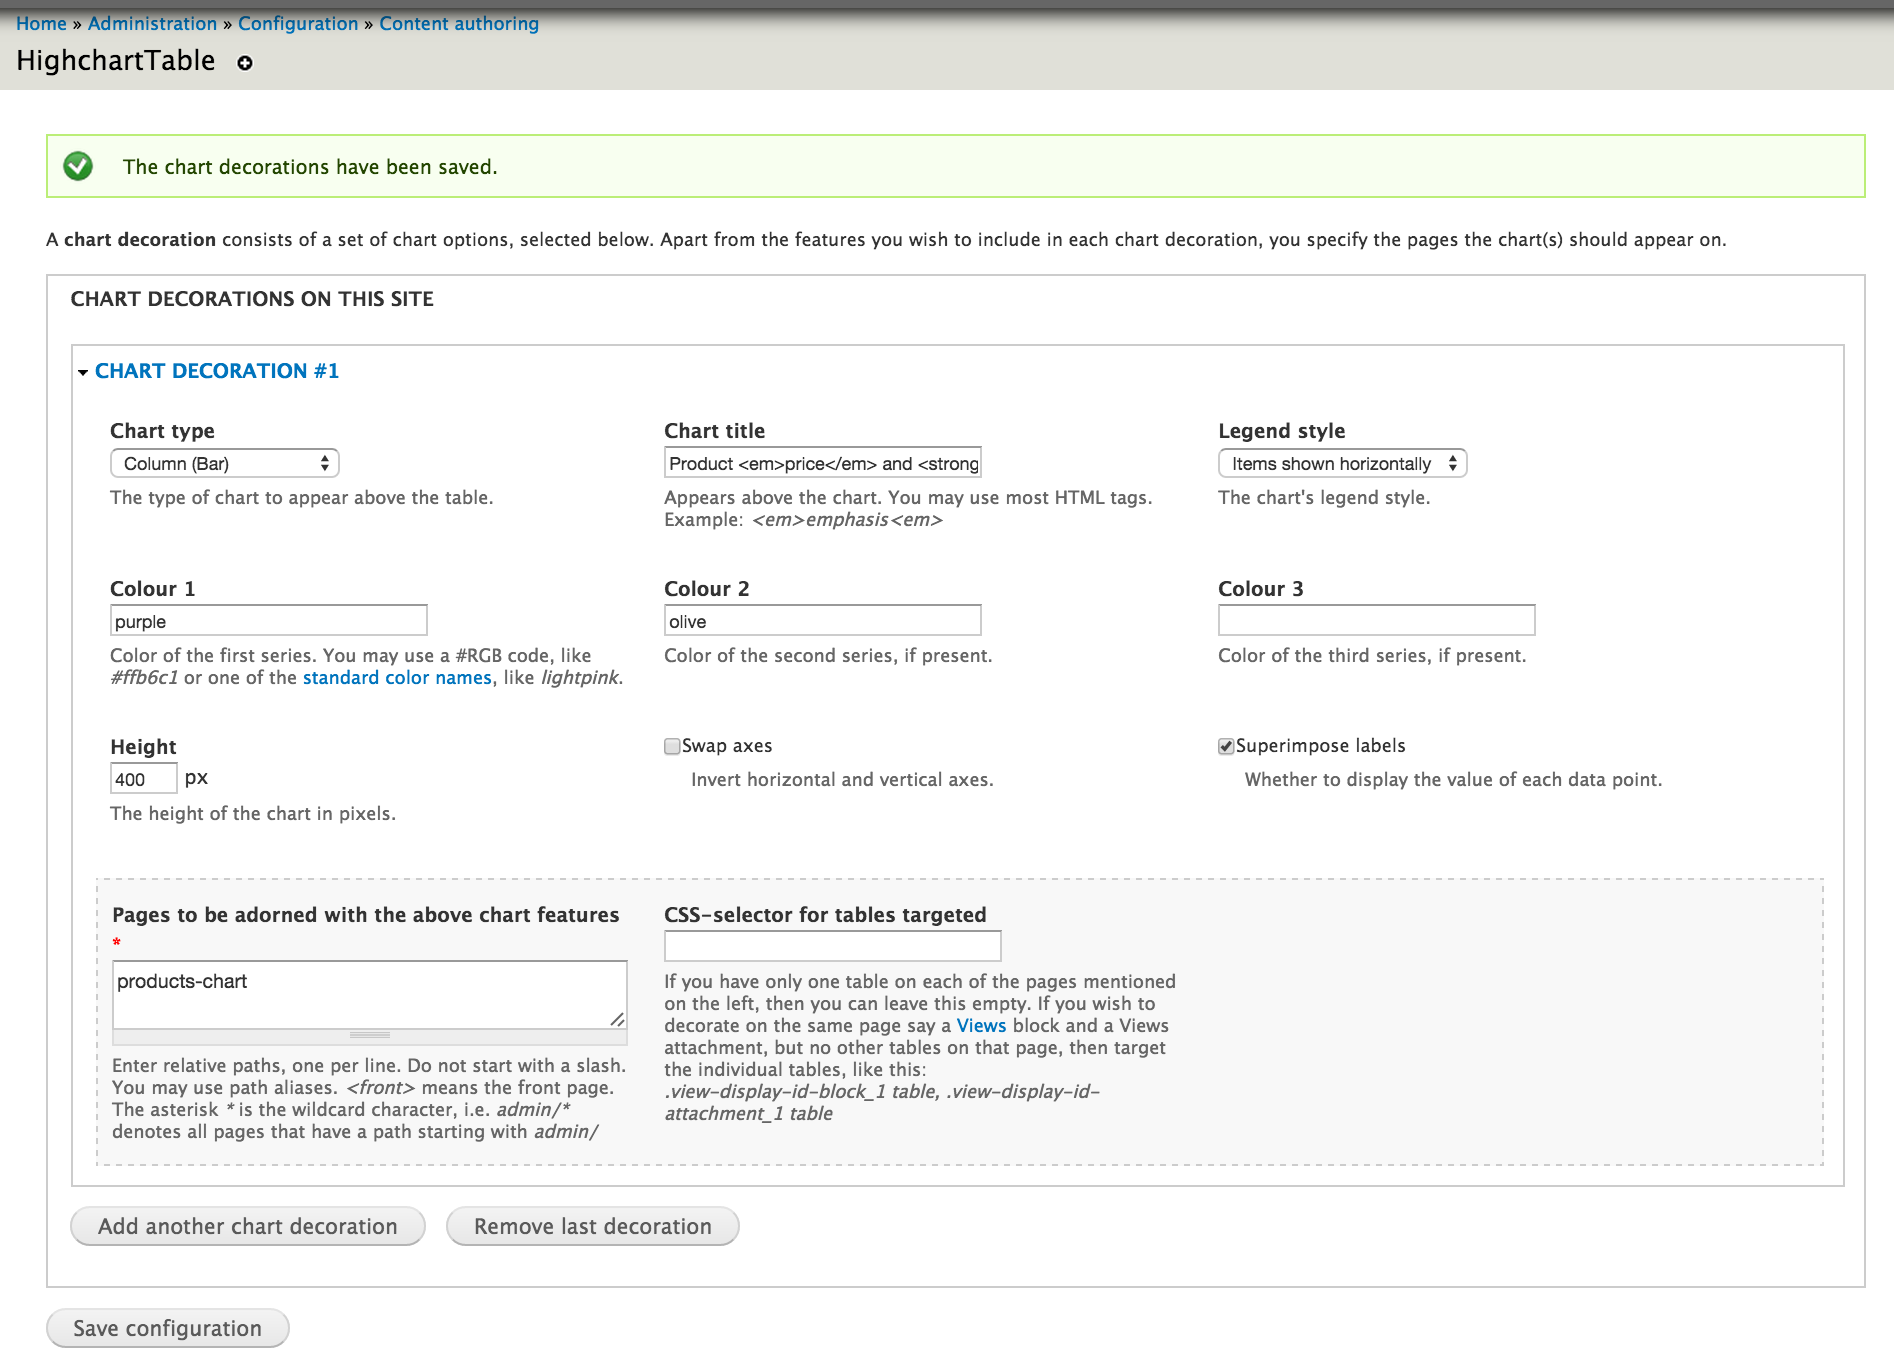
- No API to deal with, no coding, no special content types. Just find or create on your site a numeric table, click Insert chart from table, then click Configure to add further "decorations" as you please. Choose from Line, Spline (smoothed line), Column/Bar, Area or Pie. Pick colours, title, legend style ...
- Unlike most charting modules HighchartTable is not implemented as a Views plugin which would have made it mutually exclusive from other plugins. Therefore you can use HighchartTable with any Views plugin, such as Views Aggregator Plus.
- Creating a chart from a table that you already have on the screen makes configuring a chart dead simple. It avoids duplication of configuration and removes the complexities with field types and how these might be rendered. The module examines the cell contents of a table already on your screen and converts it to a chart, client-side. So it is irrelevant how the table fields were composed server-side.
Quick install
If you like using Drush, then you can download the module and its two dependencies like so:
drush dl highcharttable
drush en highcharttable
drush dl-highcharts
If you do not wish to use Drush, please refer to the README included with the module or documentation page.
With the installation complete, find a table on your site, hover above it to see the Insert chart from table cogwheel link and click it. A chart derived from the table data will immediately appear in situ. The chart may be configured further by clicking the Configure this chart cogwheel link.
Specific example?
Try the above paragraph on this page: .../admin/reports/visitors (if you have the core module Statistics enabled). After you've hovered and clicked Insert chart from table you've got a chart. Ok, horizontal axis is perhaps not our favourite, so let's change that. Hit the cogwheel again, selecting Configure... . Then change Column to use as the horizontal axis to 2. Save and admire the result :-)
Module dependencies
Third party libraries
Both of these are javascript libraries:
- Highcharts, free for personal and non-profit use, modest cost for commercial sites.
- HighchartTable, free.
This library is optional as a patched variant of it is included with the module and enabled by default, adding a few extra features over the original.
Background and roadmap
Yet another charting module is confusing, at first. We created HighchartTable because we needed easy-to-use charts for Views plugins. Because most charting modules are themselves Views plugins and Views plugins are mutually exclusive, the majority of charting modules cannot be used for this purpose. A minority may be, but add the burden of making you write PHP code.
There is something to be said for rolling this module's unique functionality into an established module that already supports Highcharts, such as Charts. However architecturally the approaches are poles apart and it seems little synergy might be gained when trying to merge them. Even building a common configuration UI will be cumbersome.
In the meantime there is nothing stopping any user from employing one module or another, or multiple at the same time. Horses for courses.
Acknowledgement
Development inspired by the sandbox project Views Table Chart, so all credit to apmsooner for his research and code.
HighchartTable module implementation approach based on Table Trash.
*) The current maintainers are apmsooner, CChow and RdeBoer
Supporting organizations:
code and documentation
Project information
- Project categories: Content display, Developer tools
 134 sites report using this module
- Created by rdeboer on , updated
 This project is not covered by the security advisory policy.
Use at your own risk! It may have publicly disclosed vulnerabilities.


