Problem/Motivation
I've noticed this before, a lot of views:unpack_options cache entries show up in performance tests and cache data but I can not see any expensive options that they are actually preventing, it seems to be pure php array manipulation.
While looking into caching issues with #2620980: Add static and persistent caching to ContentEntityStorageBase::loadRevision() I noticed this again in the cache set operations in \Drupal\Tests\demo_umami\FunctionalJavascript\OpenTelemetryNodePagePerformanceTest::testNodePageWarmCache() on the data bin, which look like this:
[data] => Array
(
[0] => route:[language]=en:[query_parameters]=:/en/recipes/deep-mediterranean-quiche
[1] => route_provider.route_load:d8ea74446fffb7fe536a2e4ad2c212f1896301b0be5dfb6a56bc3ee24a38d17b400b2d0ae81a77161ae6ff0f08259e8fb0bcee635b837ac84892ed48efa3c329
[2] => views:unpack_options:c8ca542f21fe555715ec945baaa115ad3d510414d06ca85146e1862043398eca:en
[3] => views:unpack_options:ec5b38d6b97da319831a78a71539aaaa55da97b5bd13e5b4d134e490f49a8f9e:en
[4] => views:unpack_options:11f0ea986fd78a01def6c2c30e4d2c8bfa64c79dea62b9ff06807b741cc325c6:en
[5] => views:unpack_options:aa6ba065e99c8a4396bdf5c0d1a1d1cafcee09919f54a3a9a2653a153f0f1206:en
[6] => views:unpack_options:04fcb3d9c250d2ddffe9420c250d00ff2ded7005c2a16afe98b63f27014e828b:en
[7] => views:unpack_options:d6918bc21f4e29cbc5bdcaa463a0218a7ee1e1ce7ea9e1dec7cbaaea3979c1a0:en
[8] => views:unpack_options:15c2bd6a17eef60b3064fef2c251d02c73aef060ee5de922dacf1626c579be19:en
[9] => views:unpack_options:54575a71a40b45aaf940c8a61f5403fd018fd975711895086ae7e8b080e021cd:en
[10] => views:unpack_options:ddfb0225b5de92f55552156e287bebd4a5d315ff4b60a166780358517fbbec7b:en
[11] => views:unpack_options:d4805e5b90749dcdd252b22b48e20a5349b42a0f7b93122ff3b5a08497685cf1:en
[12] => views:unpack_options:5660e0c981fbc5285bf6ff751ae0917a439b951398f3313adcdf004411b73fc3:en
[13] => views:unpack_options:c9b13e3d4640fe7685ecd3db518b76b7caecc6bec47a5a7bf1ba0b7f533d1b6b:en
[14] => views:unpack_options:292b2e03fbed43403c9828833309ef0cfb8283d6f357684ef8a8d4050d76ba42:en
[15] => views:unpack_options:7fecc4f05f26ff839e08155e0ca93192a2efbb78eee6bcbad97d9e16553c699d:en
[16] => views:unpack_options:2f33ab8c057fe032cc7ed423769ea3cfe2f4d48f52ab71ac3093c44d5b9247f7:en
[17] => views:unpack_options:a76914fd056e41810b25c43237162b1f79341beec62eb0e126ecc281c653ece5:en
[18] => views:unpack_options:2993b4ae5ccda3371a3692339001b7980dd1591afb4a8d4617730303c1359972:en
[19] => views:unpack_options:9cc6cba362825e77efc40180c61c8ffea7d5fa7716fa3a70689d3f6c20ca9993:en
[20] => views:unpack_options:871d2d94ef80b57ba3e2eae21f6e96c29005c39d7448d74e266a4fc2aad030c2:en
[21] => views:unpack_options:ecf30b34777fd3b1ba5190baa2ea83d6e08ec4b0e50d641fc8cd22012769260e:en
[22] => views:unpack_options:e6d902bb737d1288da6c15edb85a1a54c058ac03ef5f6228ae5a435770dae9d4:en
[23] => views:unpack_options:814a280c52e272901dc0bc4b178f1bbc262895ef88e0705485c3b250444b7ea3:en
[24] => views:unpack_options:c4d7e848bf6cc2d0d977431de89a727bbe6074f75d62b47e204d33588aa3a8a9:en
[25] => views:unpack_options:6f66575169d011eb671bb9324d9f6df017aec36ccbffd07541ad61bc50ec693b:en
[26] => views:unpack_options:079833b23f9bb1d55d16a496e10e67c325a3fe338c0ef4d176633b94b2133890:en
[27] => views:unpack_options:cce7af386cdfb440b51786ee0465f448f7fbf41d0fea501993cc07630e726ab6:en
[28] => views:unpack_options:17a9e5b27534679c0655eaf1edc68a1a681ec77d333a69458fdfd6acf4f1ec4a:en
[29] => views:unpack_options:c3d64cf9ae151ddc8b0d0d025f7b45691c0bd45b5cc63a846942e80e419fedaf:en
[30] => views:unpack_options:77c88dedd3edc7cba7ca39de02ed98ac45da0c90d0d7ea9c01aaab28e7ce6fdf:en
[31] => views:unpack_options:8ea910c2a96328009e029780ca243273b9818c610eaf6c123e22532e393e08cb:en
[32] => views:unpack_options:6381022ee72fecfbad6c3c2dba9f7be60b36a5369764b9d9dfb3896ff85e546b:en
[33] => views:unpack_options:100ebe94a5b5a4bf03629ecba0428acc0f3159a5c7afabed2d1c0cea03774f9b:en
[34] => views:unpack_options:3487a9dd19a65addbf3a0d40d0422d7bf46fc6ac04a8b6aa2a01cb49260a19d7:en
[35] => views:unpack_options:0b18b5b30236d7d0a6e42f50ae720eff2002353f69de745648013320c250dba0:en
[36] => views:unpack_options:6ec4a8dce8795c6cc2eeedff3edd93d9c27cbeccb63f679ed64b23b795a6ae87:en
[37] => views:unpack_options:e6db6b8779d2321269d759cdb46d6c485983c1cb020081aa24d43dac948399a4:en
[38] => views:unpack_options:c08346355bcd6dcc0b5e8107d0fe33901c814646d5f404ed5f13b7c2f5ad7678:en
[39] => views:unpack_options:8257e3933f41ec29c7619fa2978379db38c146fc85d1f61be9e641720d3e736c:en
[40] => views:unpack_options:9ab08b3b6fc2cbdf0429e8f8cd46abad393d710bd7fc2618932599954b34a1f5:en
[41] => views:unpack_options:56aed3a27a2d5eab84d8952559d748a39034fe2c2e07d34c72ce010e4b53ec04:en
[42] => views:unpack_options:91f377b6ec4c2eb6d2d93c097b5c315b157403474346f419dc7f40d96a56c583:en
[43] => views:unpack_options:10ec9753996a08cdff6188dc08b7b58b9903a450ebbe7973ab2b755248bef7d9:en
[44] => views:unpack_options:740f57fd2d91d2dbf6f61776f96f7caaf3dc3a120d575720da9e57d4ce0767b0:en
[45] => views:unpack_options:9240ce6366a0e472d5d08686a0d0beba898b322a432d8cbdd6382c24d85fabe2:en
[46] => related_recipes:related_recipes_block:results:3d917b537ca2f63a338e0ea160b71699de2d10218d790c27d3cbfc54259d420c
[47] => route:[language]=en:[query_parameters]=:/node/19
[48] => route:[language]=en:[query_parameters]=:/en/recipes
[49] => route_provider.route_load:0e96aa49863416ebe0a401b23e9e9db36ab557be8d814e389a193a68446aaf25ec1d236e30deb2c5010eaaa3bccbd56f35812e61833b94642356d37f21c53e88
[50] => route_provider.route_load:95682e519bc8564af322158abf7a28328d3ba3eeb1747b25ef22f7f909bafe4562caec8bff43c172a310a5b3fa938601a7b8b48dc7aaabc9246ba4f82596e3bd
[51] => route_provider.route_load:3ad1ebd9576785069037e4d34c248615e69dfa9e22ef7937eba2a342769765850fb6583064190cc4f92fa20e9112e58976b8641358eaddfaa27839d68bd8ccd3
[52] => recipe_collections:block:results:960895afdf7cd496c1d5b8f6abe5b748a03c67a8655bc32b685a15ff570c7471
[53] => css:umami:umami:enzQ9iXghJdv4-koINurbC2_30HCqRt7skQ30cjQPGD7Q1
[54] => js:umami:en:B7VWybvrMtyyX4s_-zk0TN9dEo_nYjPyHOTnbxTwu5I:1
)
That's 44 cache writes.
Looking at blackfire, with enabled cache, if I remove the persistent cache, I can't even see \Drupal\views\Plugin\views\display\DisplayPluginBase::initDisplay() show up in profiling. FWIW, I only 4 get cache get calls, I think this is happens during route rebuild or so when it loads all views.
The actual savings are small, but it also seems rather pointless to have.
Steps to reproduce
Proposed resolution
Remaining tasks
User interface changes
Introduced terminology
API changes
Data model changes
Release notes snippet


Comments
Comment #3
berdirI'll look at the performance tests when #2620980: Add static and persistent caching to ContentEntityStorageBase::loadRevision() which is more important.
Comment #4
catchI went back and looked at when it was added #402944: Persistent caching for unpack_options() calls from building displays - 2009 and 2011 (two commits).
At that time, Views weren't config entities, and when we checked access or similar on a tab, it would load and build the view from scratch for every tab with no static caching or anything (this was called 'menu loaders' at the time - a load callback for hook_menu()). We tried to add static/persistent caching for views (similar to config caching now) but it was too hard, and this was the most expensive thing to cache at a lower level.
Now at least three things have changed:
1. Route upcasting (as it's now called) only runs once per thing being upcasted.
2. Route access checks etc. themselves are cached.
3. Views output outside a route context also gets cached in the render cache.
So what used to be a very frequently read cache, is closer and closer to being write-only during routing and similar as @berdir points out.
Wonder a bit whether we even make use of the static cache now too, it might be possible to get rid of that if not.
Comment #5
berdirUpdated the performance tests, very nice diff. As an additional positive side effect, it also removes/pushes back a number of views cache tag lookups, which means better grouped lookups.
I also removed the static caching, I agree with #4. The calculation of the static cache is non-trivial too with the serialize. Hard to proof since the whole thing doesn't even show up in profiling anymore, but that also adds to the fact that we're maintaining complex code for no measurable benefit.
To add to the reasons in #4, PHP as a language also made *significant* improvements to performance since 2009, even if we'd run those things as much as we used to, it would be a lot faster.
Comment #6
nicxvan commentedThat's a nice improvement, is there any way to manually verify?
I don't have blackfire, but maybe xhprof would show the same findings?
Comment #7
berdirYes, it should, on a regular request with one/multiple views, you should see that without caching, the initDisplay() method should either be faster or completely vanish from the profiling results as loading from cache is actually more expensive than the work it caches.
Comment #8
catchWithout actually testing it, I think that using the front page or node page of Umami (both of which have views on), and truncating the cache_dynamic_page_cache and cache_render tables prior to loading the page should mean the code runs.
In xhprof if you view the full list of functions, need to make sure initDisplay() is actually in the list somewhere, otherwise it's possible the page didn't execute it at all and have to tweak the steps to reproduce.
What I usually do is screenshot the xhprof detail for the function (at the highest level of the stack that makes sense, which is probably initDisplay()) before and after. It's very imperfect but never found a good way to host/display xhprof runs in a persistent way online.
Comment #9
berdir> In xhprof if you view the full list of functions, need to make sure initDisplay() is actually in the list somewhere, otherwise it's possible the page didn't execute it at all and have to tweak the steps to reproduce.
I haven't verified this with xhprof, but with blackfire, initDisplay() was actually not visible anymore at all list of functions, they do filter out some things that only make up a tiny fraction of the time.
Instead of clearing cache, I prefer to set the page/dynamic page cache/render bins to null, then you can run it repeatedly. You can also set a breakpoint there to make sure it's called on your request. But do not run/enable profiling and xdebug at the same time.
Comment #10
catchxhprof shows everything, you get a very long list but it does help to rule out profiling the completely wrong thing.
That's more organised than me.
Comment #11
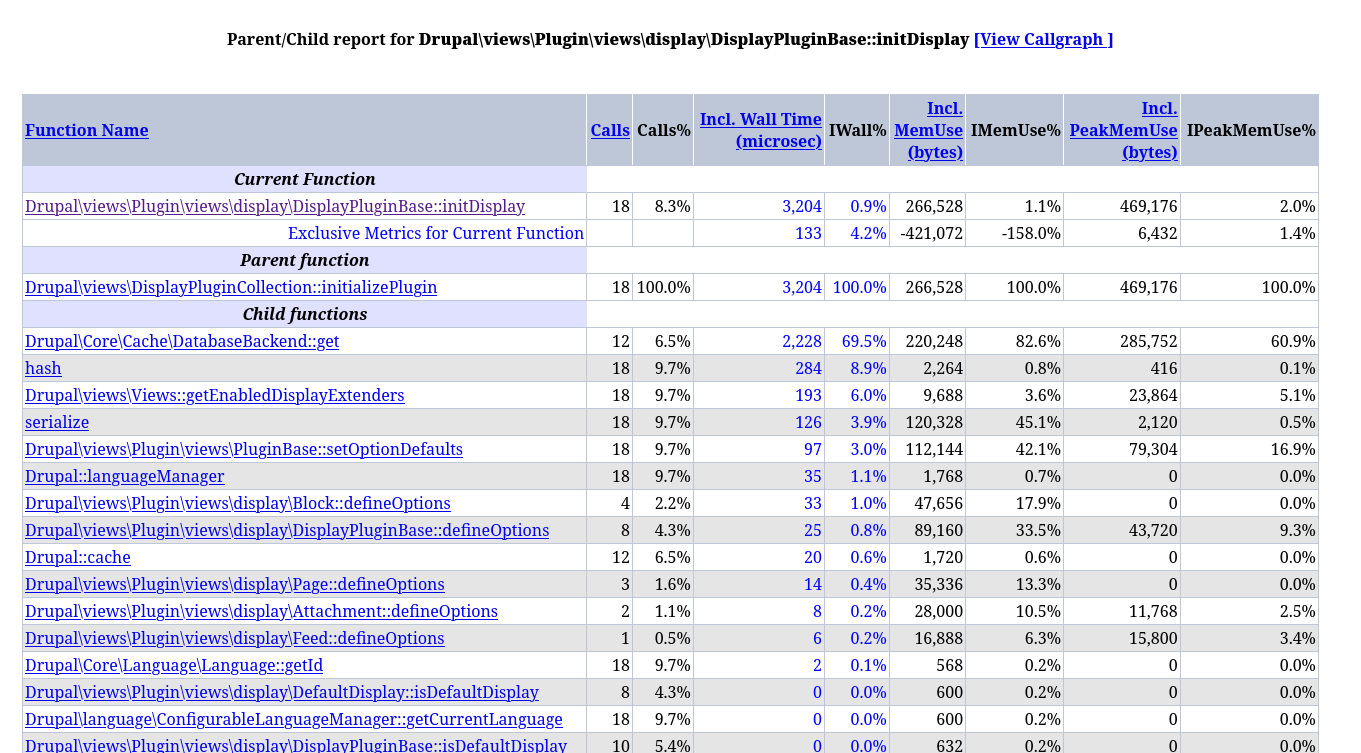
berdirFWIW, I get mostly the same behavior on xhprof with ddev as with blackfire. demo umami, fresh install, frontpage 11.x shows it, 18 calls, 3,204 microseconds wall time (0.9%).
On this branch, it does not show up. I verified with xdebug that it stops there.
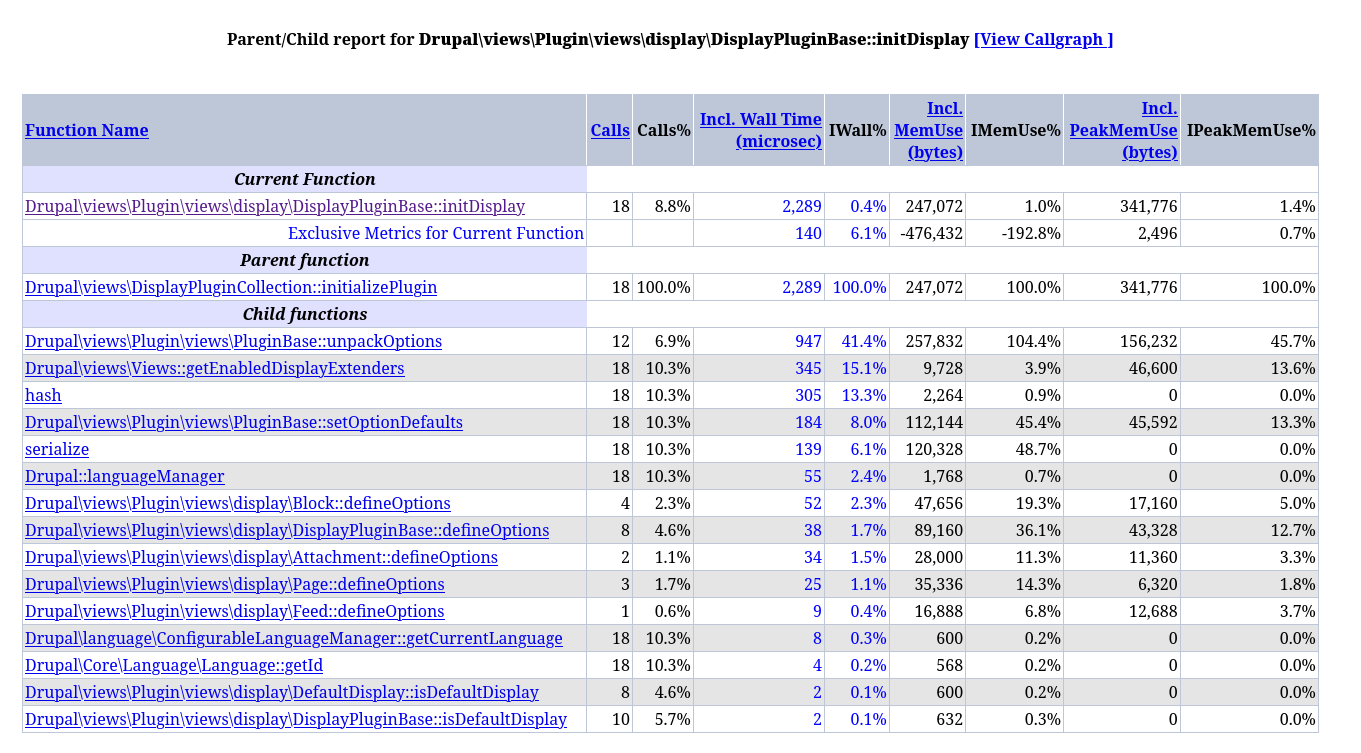
Unlike blackfire, it does show up when I keep the static cache. There, from 18 calls, there are 12 calls to unpackOptions(), so the static cache avoids 6 calls. But all unpackOptions() calls that we do run only takes up 40% of that time, and calculating the static cache key is also around 20% with the serialize and hash calls.
Worth nothing that with such low numbers, the variation is likely very high and overhead of profiling is high. but I think it's sufficient to show that the actual logic is less expensive than the caching, definitely for persistent cache and a bit of a wash for static cache, would at best be helpful if we'd hit that a lot
persistent cache (11.x)
with static cache (earlier version if this)
Comment #12
catchDid some before/after profiling and got about 9ms with 11.x, and about 4.5ms with the MR - for me the function shows up in all xhprof runs, wonder if there's some kind of environment/config difference between berdir's and my xhprof setups.
But either way that confirms it's a good performance improvement as well as simplification.
Comment #13
nicxvan commentedI pulled this down and tested umami manually too, it looks great.
I also compared the screenshots from catch and berdir and they look consistent.
Comment #14
catchThis doesn't apply due to #3538006: Optimize EntityFieldManager::buildBundleFieldDefinitions() which knocks another 20 queries + cache gets + cache sets each off the same test.
On the plus side, once this lands we're looking at about 200 less queries / cache sets / cache gets / cache tag lookups combined reduction in the umami front page cold cache test compared to 11.2.x, which is really a huge reduction in less than six months.
Comment #15
berdir@catch is it possible you had an older local branch? I rebased this yesterday a few hours after that issue got in and I just did another local rebase against 11.x, no conflicts there.
Comment #18
catchHmm I don't think my branch was out of date, but maybe the tab with the diff in it was or something? Either way that's great and committed/pushed to 11.x and 11.3.x, thanks!
Comment #21
nicxvan commentedThanks! I took a pass at applying credit.