
 Come together with the global Drupal community in Rotterdam, 28 Sept – 1 Oct 2026. Sessions, contribution, connection, and Early Bird savings until 8 June.
This project is not covered by Drupal’s security advisory policy.
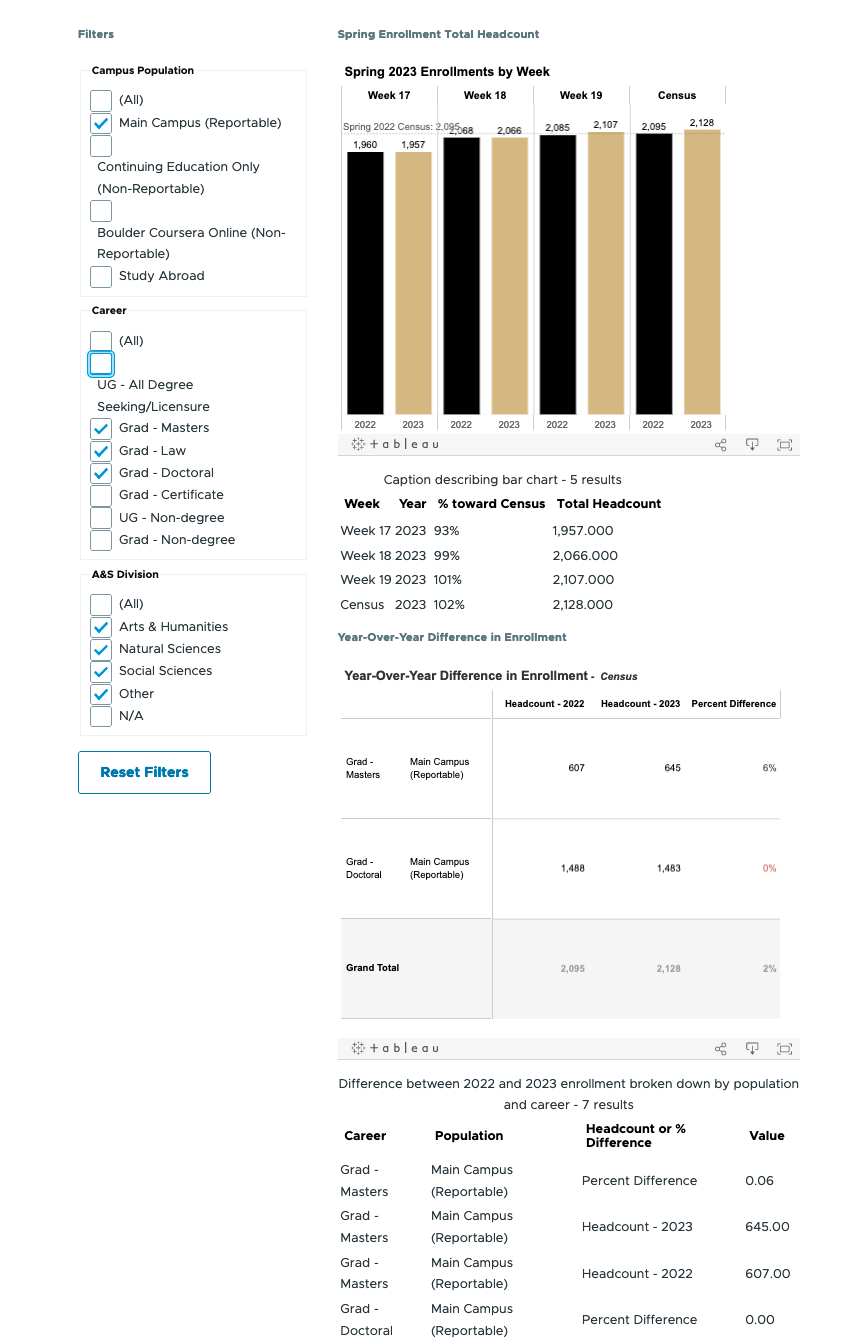
This module enables users to create assistive technology (AT)-friendly dashboards by integrating Tableau visualizations with standard Drupal elements and semantic HTML. The module uses the Tableau API for dynamic control and updating of embedded visualizations and data tables.
Features
- Overcomes AT navigation challenges in Tableau dashboards.
- Provides accessible semantic HTML control elements for filters and parameters.
- Bypasses common inaccessible Tableau hacks (e.g., sheet swapping, reset filters).
- Provides ARIA tags and CSS for enhanced AT user support, including content visibility toggling and custom help.
- Improves focus and keyboard navigation order.
- Adds non-visual feedback for dashboard updates.
- Simplifies access to HTML data tables
- Offers control of data table headers.
Demo Capabilities:
- Custom dashboard layout with HTML structure and ARIA tagging.
- Two data block types: viz'es (charts with data tables) and metrics (Big Numbers or BANs displaying key data points).
- Controls apply to all viz'es and metrics on a page.
User Configuration:
- Viz'es: Specify Tableau sheet share link, visualization caption, columns for exclusion, and data table headers.
- Metrics (BANs): Specify Tableau sheet share link, descriptive text, data format type (string, integer, float, percentage, currency, date), and metric source column.
- Filters: Set Tableau field names and control types (radio, checkbox, dropdown, multi-select).
- Reset Buttons: Assign button text.
A video describing the project and demo at Drupal Camp Colorado 2023 - Data Viz for Everyone
Supporting organizations:
Funded the initial development
Project information
- Project categories: Accessibility, Integrations
- Created by kreynen on , updated
 This project is not covered by the security advisory policy.
Use at your own risk! It may have publicly disclosed vulnerabilities.


