
INTRODUCTION
----------------------
A module is a set of PHP, JavaScript, and CSS files that extends site features and adds functionality. You can turn the features and functionality on by installing the module,
and you can turn it off by uninstalling the module. PankM chart module enables to draw charts based on the uploaded CSV file.
PURPOSE
-------------
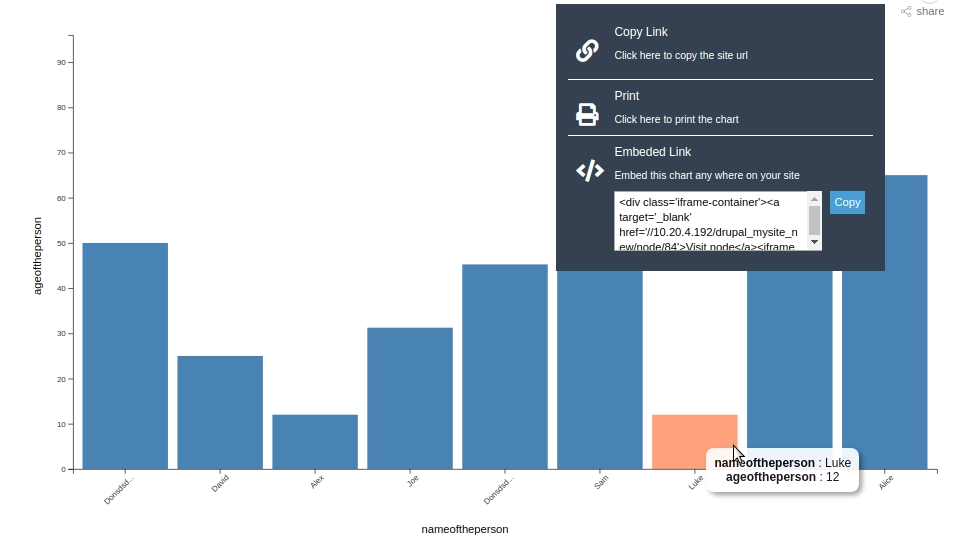
User should able to copy the embed code and use the chart in other article and blogs.
CONFIGURATION
-----------------------
After downloading the module please add the following three
external libraries in the folder "/pankm_chart/js/Scripts/"
1) d3.js
from https://d3js.org and the Version ---> v7.9.0 for [ if you are on PanKM Chart module Version 11.1.0 ]
from https://d3js.org and the Version ---> v5.9.2 [ if you are on PanKM Chart module Version 10.1.0 ]
2) polyfill.min.js from
https://cdn.jsdelivr.net/npm/promise-polyfill@8/dist/polyfill.min.js
3) fetch.umd.js from
https://github.com/github/fetch/releases/download/v3.0.0/fetch.umd.js
Install the module and visit the sample node created in "/admin/content".
For creating a new node visit the node add page "/node/add/pankm_chart".
Need the data file(CSV)(Must have a default sample file) to add a new node.
User should be able to provide data in CSV format similar to the sample CSV.
REQUIREMENTS
----------------------
The following three external files are required.
It needs to be download separately from the external link.
d3.js, polyfill.min.js, fetch.umd.js
CURRENT FUNCTIONALITY
------------------------------------
1) When installing the module the required content type and a sample node will be created automatically.
2) The user can upload their own CSV file similar to the sample.csv. The chart will plot automatically.
3) User can select the required chart type. Currently implemented chart types are Bar Chart, Line Chart, Multi-Line Chart, and Pie Chart.
4) The max CSV file row limit is 100 lines.
5) There are some options to Copy Link, Print the page and get the Embedded code.
Supporting organizations:
Project information
- Project categories: Developer tools, Integrations
 2 sites report using this module
- Created by rahulmon johnson on , updated
 Stable releases for this project are covered by the security advisory policy.
Look for the shield icon below.
Releases
11.1.0
released 6 November 2025
Works with Drupal: ^10 || ^11
PanKm Chart drupal 11 version releases
Install:
Development version: 11.1.x-dev updated 6 Nov 2025 at 11:19 UTC


