
This project is not covered by Drupal’s security advisory policy.
This module is a time, memory and hook calls measure and profiling framework. It intensively use hooks to take ponctual measures and saves it for further consulting. It aims to be non-intrusive and lightweight as possible during runtime, however, do not activate it on production sites.
Features
User interface
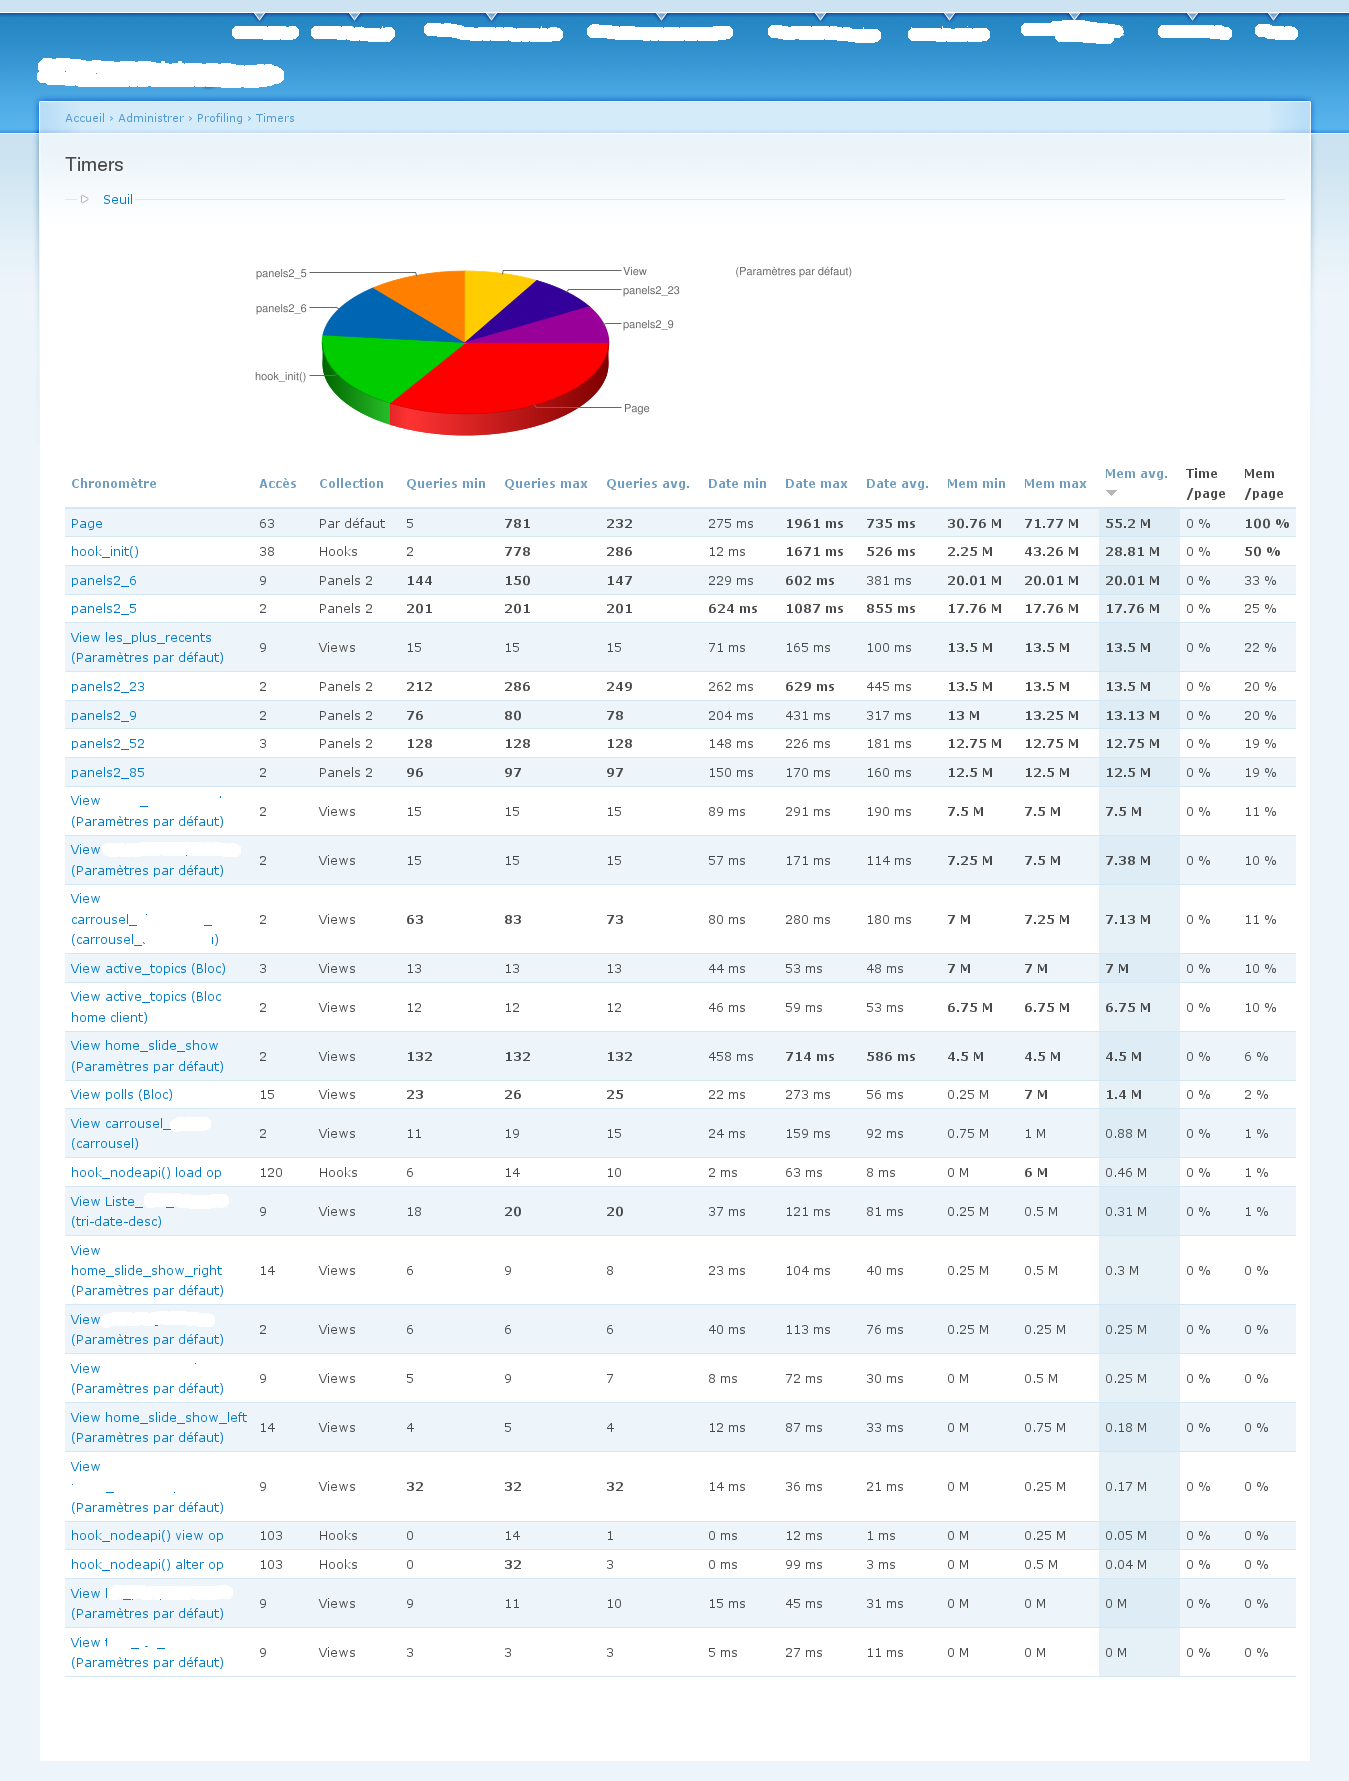
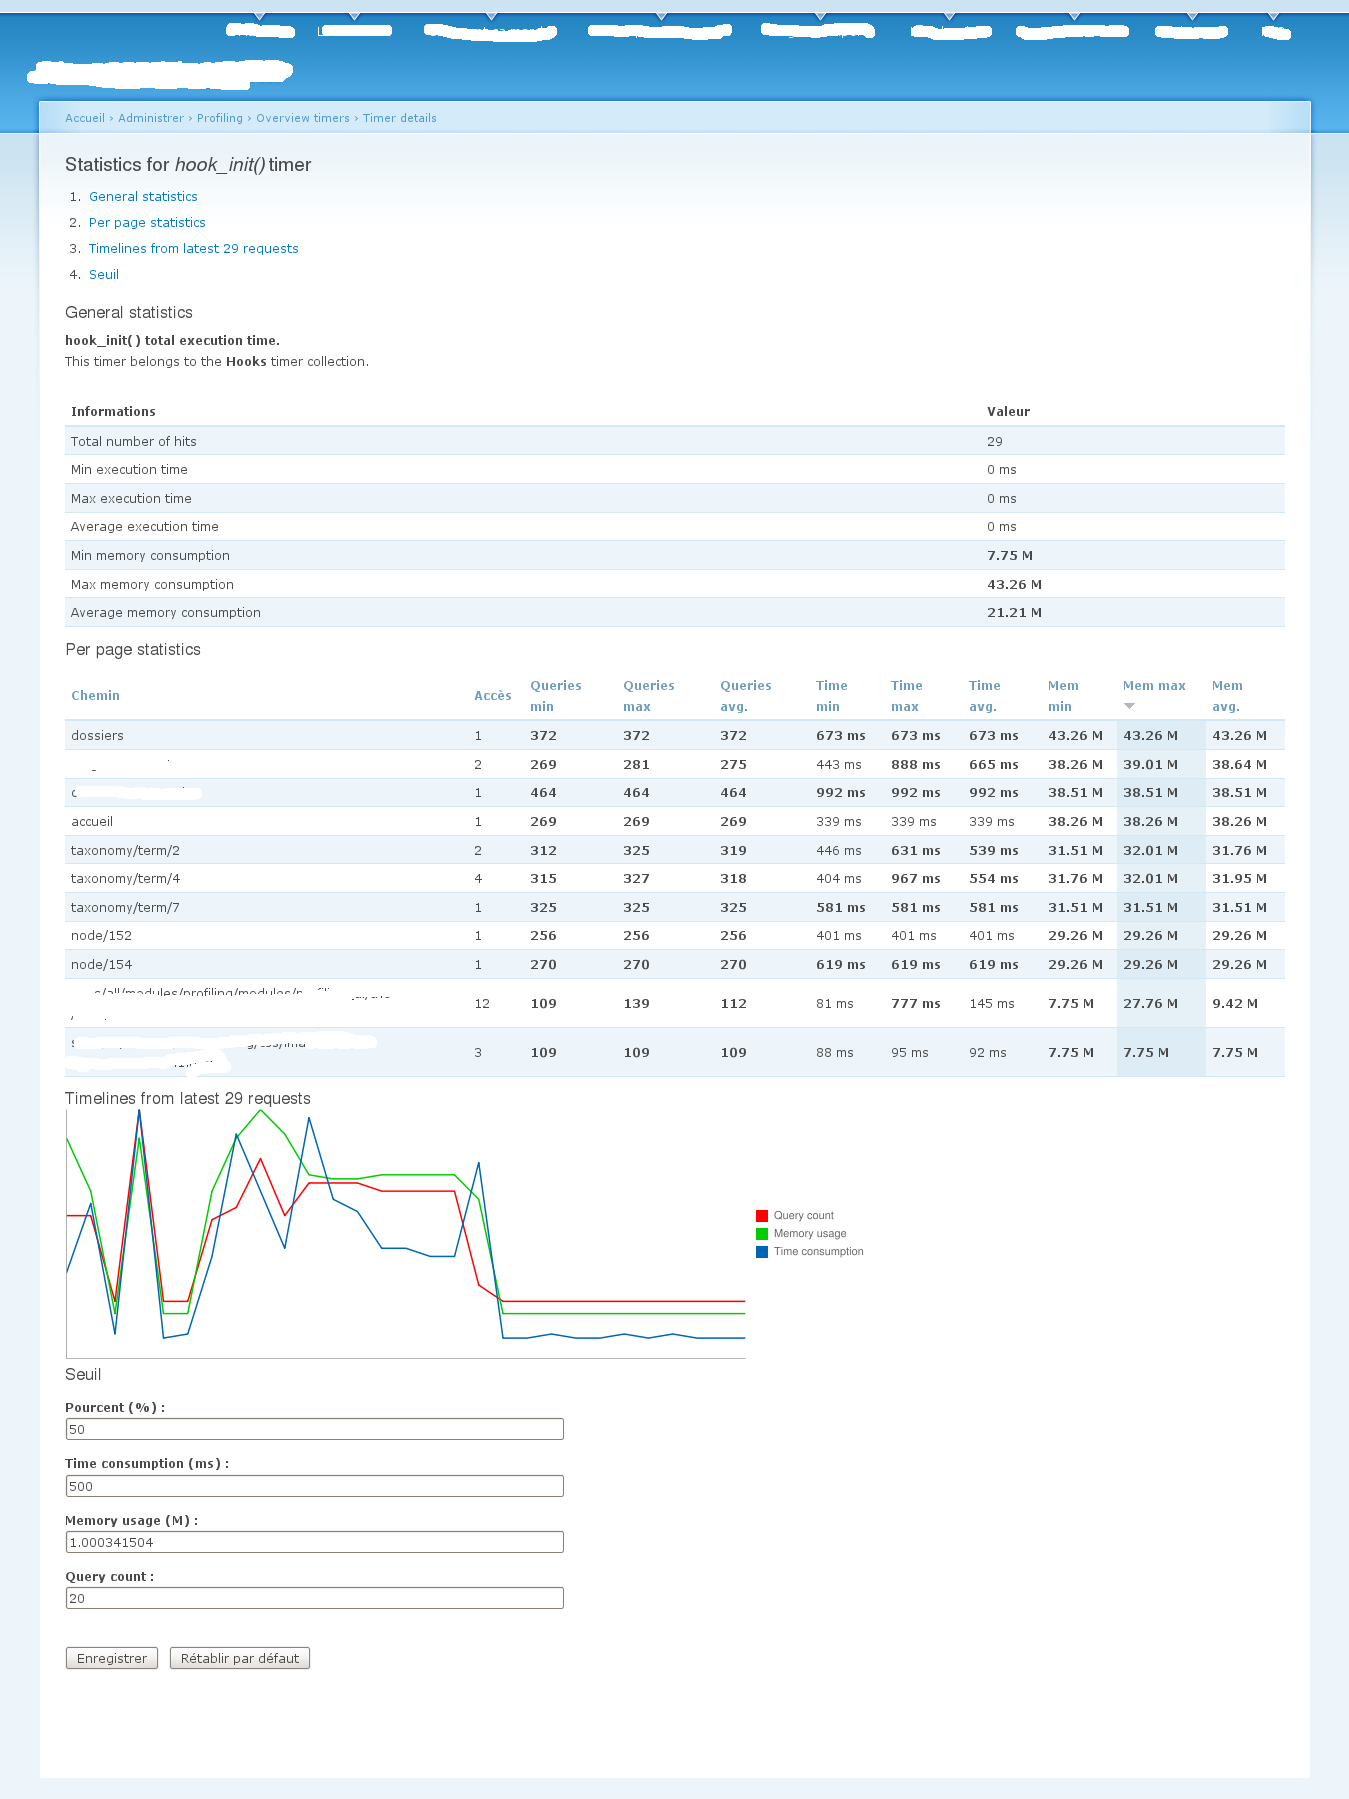
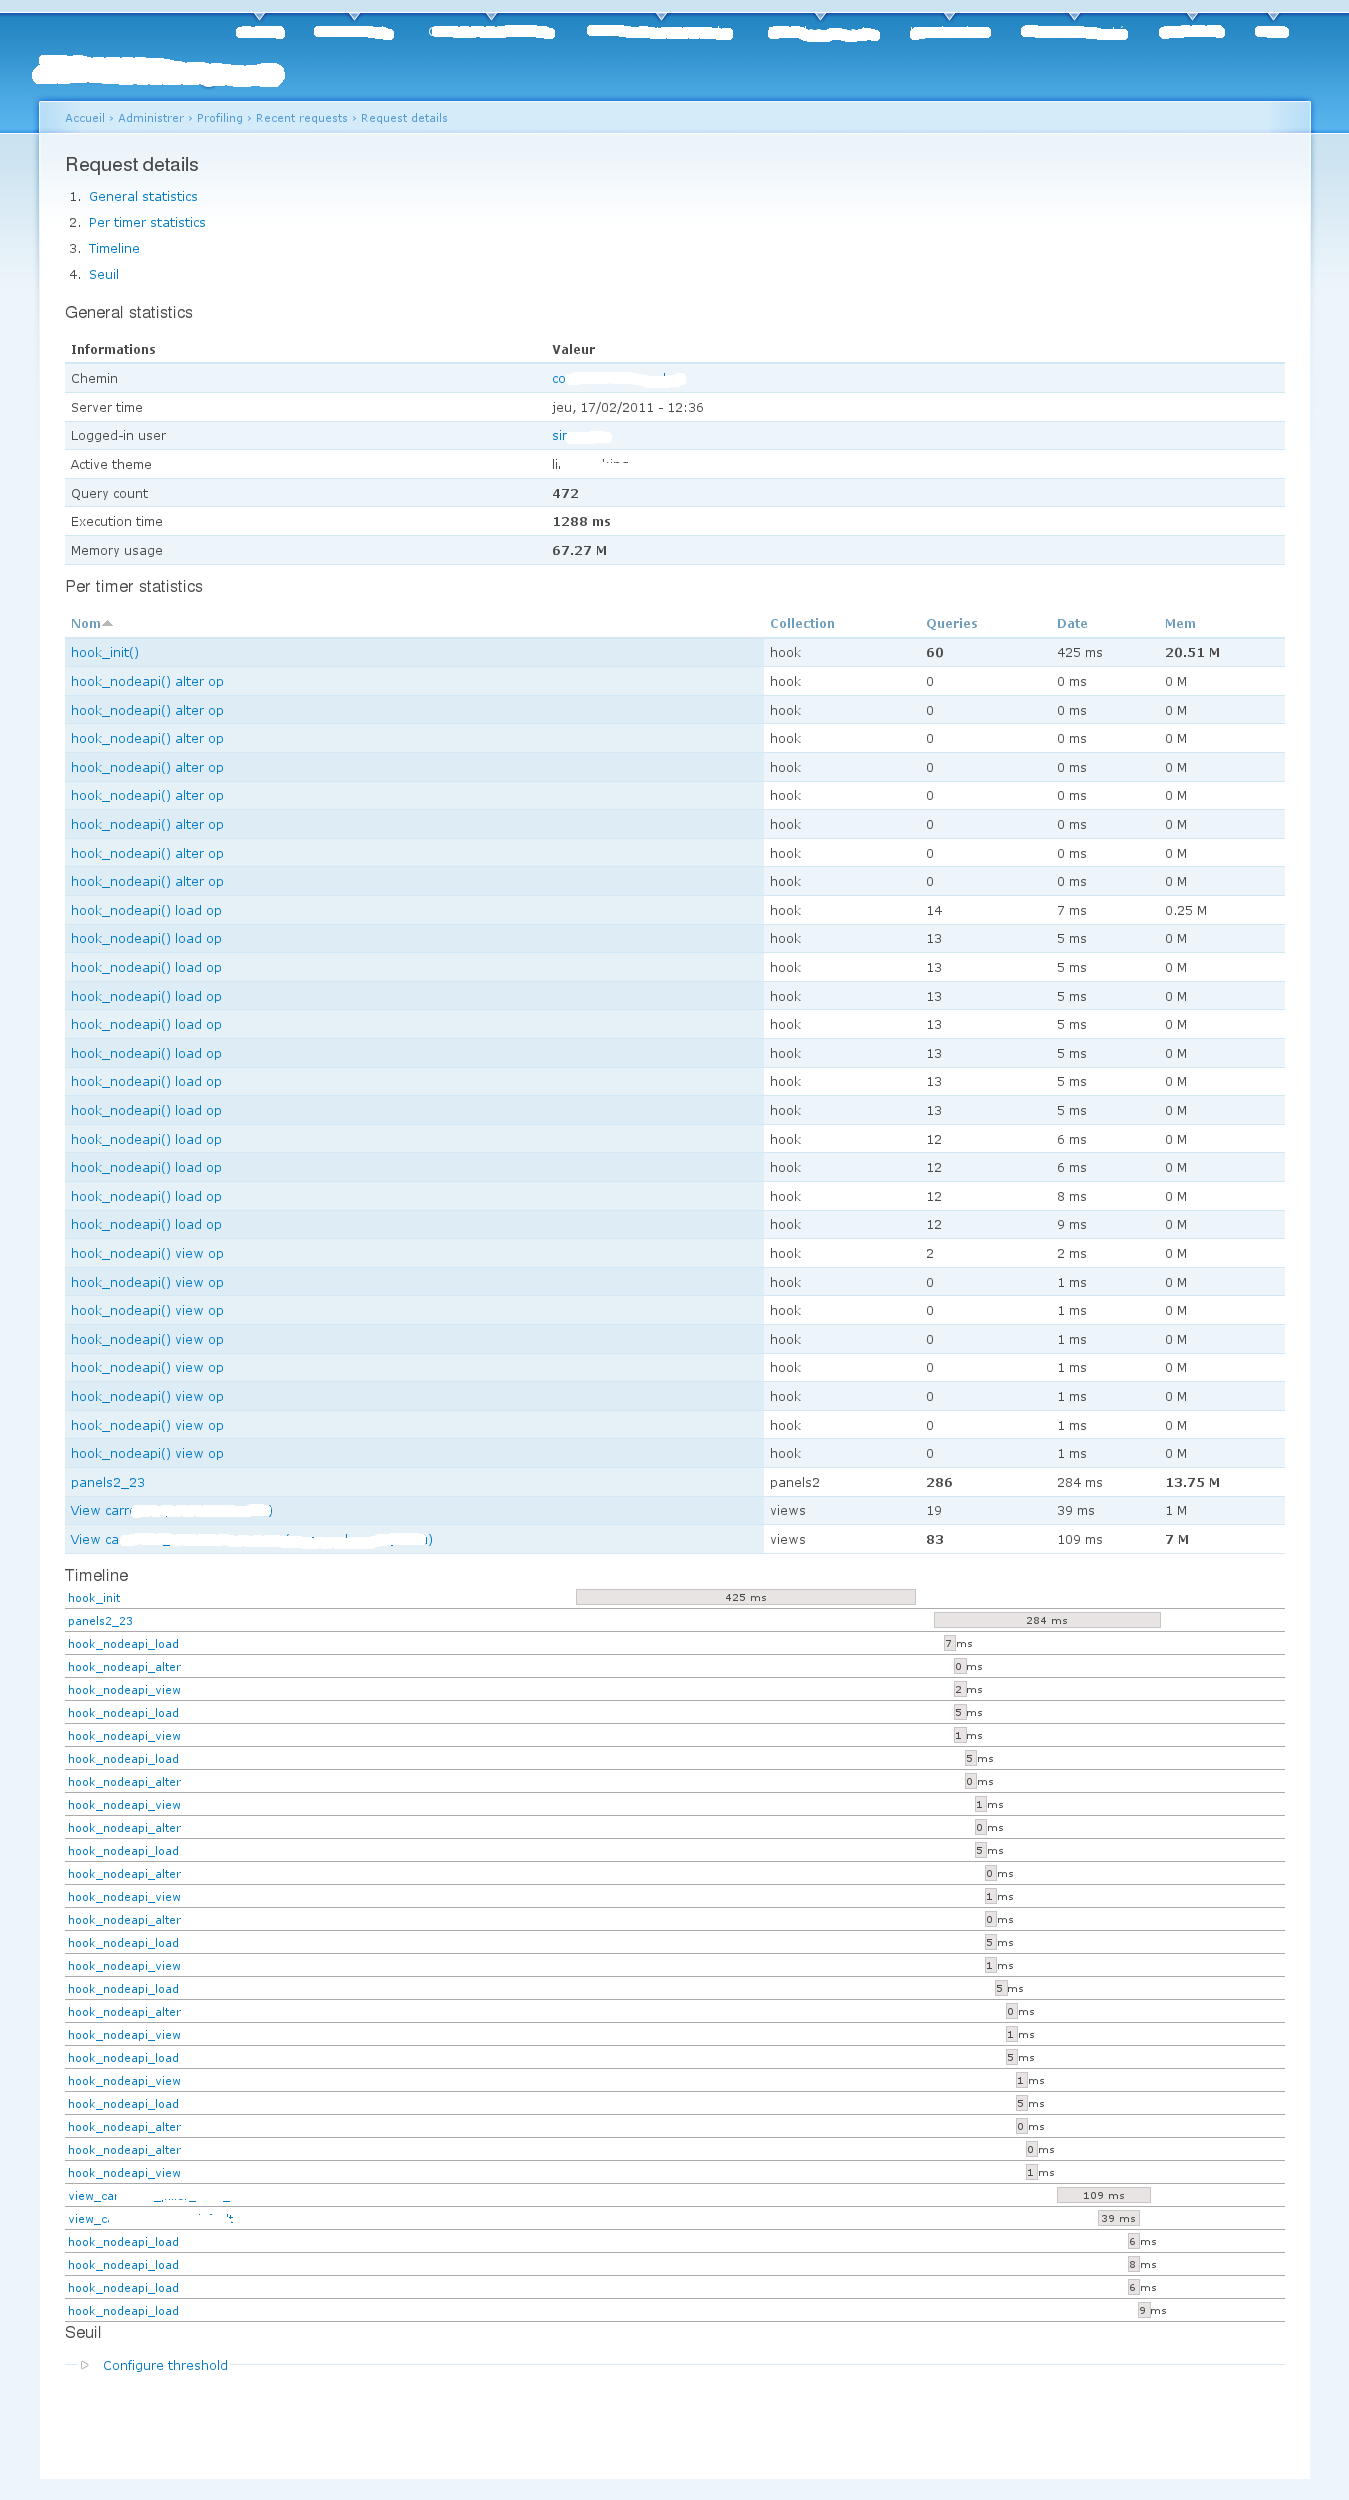
It provides comprehensive tables, charts and diagrams for measures analysis and bottleneck finding.
See these screenshots (D6 version):
- Global timers overview (outdated)
- Single timer global report (outdated)
- Single HTTP request full report
Use cases
It's not magic, therefore it only does monitor what we asked for, if you are a custom module developer, you'll have to provide your own integration to this module for it to be useful.
For sites integrators, it aims to guide you through your views, panels and other well known heavy modules in order to spot specific performance killers objects that could be better configured or rewrite as custom code for performances.
If you are a developer and you are looking out for PHP low level profiling, you can use xdebug or xhprof. These two PHP low level profilers have a Drupal integration via the devel module. Profiling aims to profile higher API level of Drupal.
Status
Current status
Currently, this module is able to watch global hooks execution time (any hook, this is configurable), but it also provide integration with these modules:
- Views
- Panels
It's stable, at least on our own testing sites, so if you find a bug please report it as soon as possible.
Future
Drupal 6 version is now frozen and only accept bugfixes. Drupal 7 is on the move, and is partially ported. It is stable but still lacks the Views and Panels support.
Credits
Development
Community
Artusamak for reporting some typo errors on this page.
Regilero for bugfixes and feature patches.
Sebcorbin for another typo error.
Some anonymous developers for making dawn slow code.
Project information
 Minimally maintained
Maintainers monitor issues, but fast responses are not guaranteed.- Maintenance fixes only
Considered feature-complete by its maintainers. - Project categories: Developer tools, Performance, Integrations
 37 sites report using this module
- Created by pounard on , updated
 This project is not covered by the security advisory policy.
Use at your own risk! It may have publicly disclosed vulnerabilities.

