
Development and issue management moved to Github
- This module is mirrored here from github.com/NuCivic/recline
- We are taking issues for this component in the dkan issue thread at github. We have a recline label in place for you to tag issues for this module
About this module
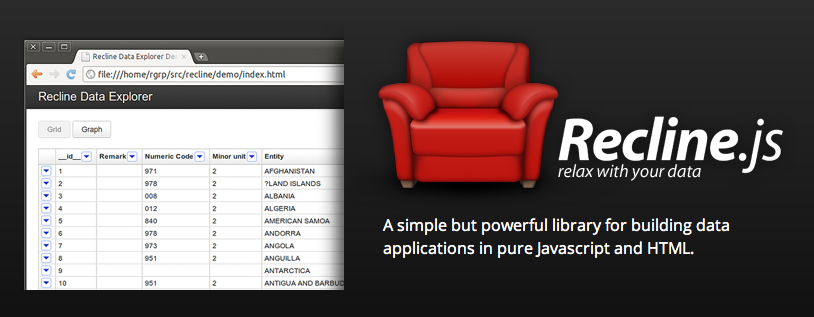
This module creates an integration with Recline.js to visualize user-submitted data.
This creates grid, graph, and map data previews for CSV and XLS files based off of the following mechanisms.
It first checks to see if the DKAN Datastore module is installed, and if a datastore has been created for the file. If the datastore is available it uses that to visualize the data. This is extremely scalable since it only queries the first 50 rows of the table in the database. It has been tested with files up to 500 GB and a million+ rows.
If the datastore is not available it checks if the file is a CSV. If it is a CSV it tries to load the file into memory. If it takes longer than a second to load the file it instructs the user that the file is too large to preview. This keeps the page from freezing for larger files.
If the file is a XLS it uses the DataProxy services to preview the file since there is currently not a CSV backend for Recline. DataProxy parses the file and returns it as a data object which is previewed.
Project information
- Project categories: Media, Developer tools, Integrations
 4 sites report using this module
- Created by acouch on , updated
 Stable releases for this project are covered by the security advisory policy.
There are currently no supported stable releases.


