

 The 2026 Drupal Business Survey is open. Your response will help shape the future of the Drupal business ecosystem.
Adds to HTTP headers of a response the performance data of the request not only
as the actual execution time in seconds (rtime), but also the utime and
stime:
-
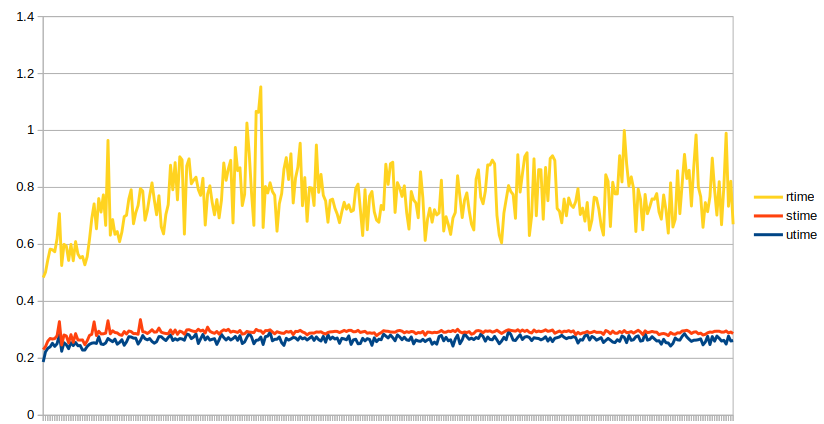
rtimerepresents the total duration of the response generation process. -
utimerepresents the actual CPU time, exclusively spent on processing only
the PHP code of the current request, excluding other background processes. -
stimerepresents the CPU time spent on kernel processes like disk read/writes
and other IO operations.
More information: https://www.baeldung.com/linux/total-process-cpu-usage#2-the-cpu-usage
Additionally, it shows the memory usage and the disk read (inblock) and write (oublock) operations.
An example of the HTTP headers output of a response:
x-rusage-rtime: 3.482499
x-rusage-stime: 0.101052
x-rusage-utime: 2.792771
x-rusage-memory: 91076728
x-rusage-memory-peak: 144699680
x-rusage-inblock: 16216
x-rusage-oublock: 192
An example chart for 10 concurrent requests to the homepage:
The data is collected by the PHP functions getrusage(), microtime(),
memory_get_usage(), memory_get_peak_usage().
Features
The benefit of this approach is to see not only the actual time during which the response is generated but how much resources the server actually spent to generate this response.
This should show more stable time numbers for concurrent requests with less dependency on the background processes load.
Usually, the rtime shows fewer numbers than the request time, but sometimes the utime can show more time than the total request time if the process uses multi-threading.
More documentation can be found here:
https://www.php.net/manual/en/function.getrusage.php
Post-Installation
The module works out of the box without any configuration, and is controlled by the environment variables:
-
RUSAGE_METER_INJECT_ALWAYS=1- enables injecting headers always. -
RUSAGE_METER_INJECT_KEY=put-an-unique-key-here- enables injecting headers only for requests with the GET query parameterrusage-meter-keyor the HTTP headerx-rusage-meter-keyequals to the configured string.
By default, it counts the resource usage of the span from the request processing start event (KernelEvents::REQUEST) time to the response created event (KernelEvents::RESPONSE).
If you want to include also the Kernel initialization flow, you should manually extend your index.php file like this:
  use Symfony\Component\HttpFoundation\Request;

+ // Sets the initial resource usage data for the `rusage_meter` module.
+ require 'modules/contrib/rusage_meter/rusage_meter_initial.inc.php';
+
  $autoloader = require_once 'autoload.php';
Also, you can push initial and final data in your own places of the code, to measure the exact part of your business logic, by using the service:
\Drupal::service('rusage_meter')->setInitialData(array $data = NULL, bool $override = TRUE);
// Do some stuff.
\Drupal::service('rusage_meter')->setFinalData(array $data = NULL, bool $override = TRUE);
If the $data array is null, it will get the current values, if not null - put
your custom values.
And if you want to optimize some specific part of your code before the Drupal kernel is initialized, for example, the autoloader, you can wrap it by requiring the initial and final data, like this:
+ require 'modules/contrib/rusage_meter/rusage_meter_initial.inc.php';
  $autoloader = require_once 'autoload.php';
+ require 'modules/contrib/rusage_meter/rusage_meter_final.inc.php';
Additional Requirements
No additional requirements or dependencies.
Recommended modules/libraries
If you're interested in monitoring and optimizing the performance of your website, please try also my other module OpenTelemetry.
Similar projects
I haven't found any similar module, if you know one - please tell me!
Supporting this Module
You can convey gratitude to me for the development of the module and motivate me to do more through these services:



Project information
- Project categories: Developer tools, Performance
- Ecosystem: Performance Logging and Monitoring (D7)
- Created by murz on , updated
 Stable releases for this project are covered by the security advisory policy.
Look for the shield icon below.

